Since the last release, I've spent some time adding new features and improving existing stuff in Mesen's debugger. At this point, I think I've implemented the vast majority of ideas I could come up with. I made a similar thread a couple of years ago and got some really nice feedback which helped improve the debugger quite a bit, so I'm hoping to get some more feedback now that the debugging tools have matured.
Any feedback is welcome - whether it's new tools you would find useful, or missing information/features in the existing tools (or even good old bug reports). I'm also trying to make Mesen as easy to integrate as possible from a development point of view (e.g compile with cc65/asm6 => import labels/etc => debug). But I don't actually develop anything for the NES, so if there's anything missing that would make this sort of workflow easier, someone needs to tell me :p
There's a preview build with the latest additions here:
downloadAnd here's some screenshots that show a good portion of the debugger's features (including some of the newer stuff):
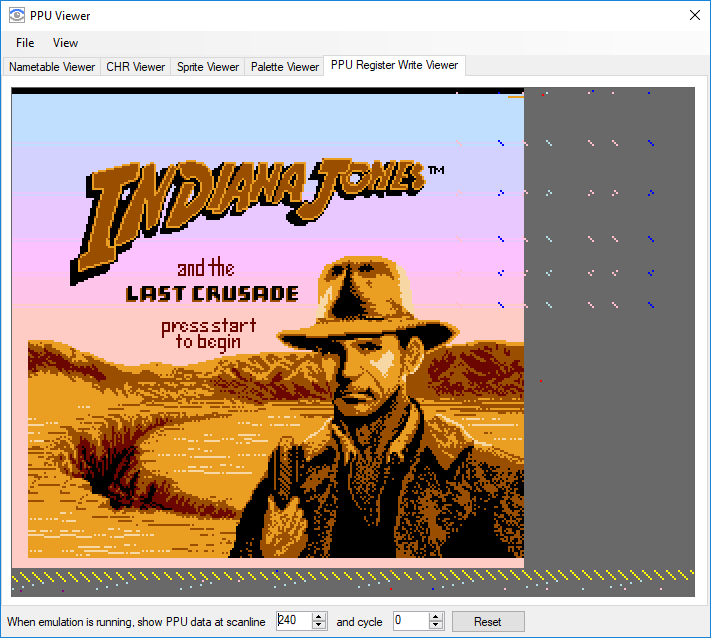
Debugger windowPPU ViewerMemory viewer, Profiler, Lua Script Window, Trace LoggerAPU Viewer, AssemblerAnd here's a partial list of debugger changes/additions since 0.9.4:
-Improved breakpoint management, including (among other things) being able to set breakpoints on work ram, save ram, palette ram, chr ram/rom
-Syntax highlighting in the code window & trace logger (colors are customizable)
-Added a tooltip popup for the opcodes which displays a short summary, shows which flags are affected, the addressing mode and the number of cycles the instruction takes.
-Added an "APU Viewer" tool to display the values of most of the APU's internal state
-Added a custom-built scrollbar for the code window which displays the location of breakpoints, etc.
-The new scrollbar will also display a popup preview of the code at the mouse cursor's location when the mouse is over the scrollbar
-Added an option to display the value stored at the memory address used by an instruction (e.g: LDA $44 = $FF). It should be identical to FCEUX's behavior (I think)
-The PPU viewer was fixed to work properly for MMC5 games that use extended attributes
-Added an option to the CHR viewer to display each tile with the last palette it was displayed with (which makes it a lot easier to recognize tiles vs displaying the entire thing in the same palette)
Disclaimer: I haven't actually tried mesen yet, and am away-from-my-computer ATM, so it could already have this feature... but as I haven't seen it in any emulator I've tried, I'd assume it isn't. So here goes:
A debugging feature I've always thought would be useful would be to actually be able to view the full 340/341 pixels of a scanline including hblank, outputting either a blank colour (or BG0 if screen is off).
(I know this might actually not be 100% correct (as the PPU most likely doesn't output any colour in hblank, hence its name). But it would really make aligning your register writes within the hblank period a lot easier, and because you would only be viewing hblank in such a special debug mode I think accurate emulation is a bit of a moot point.)
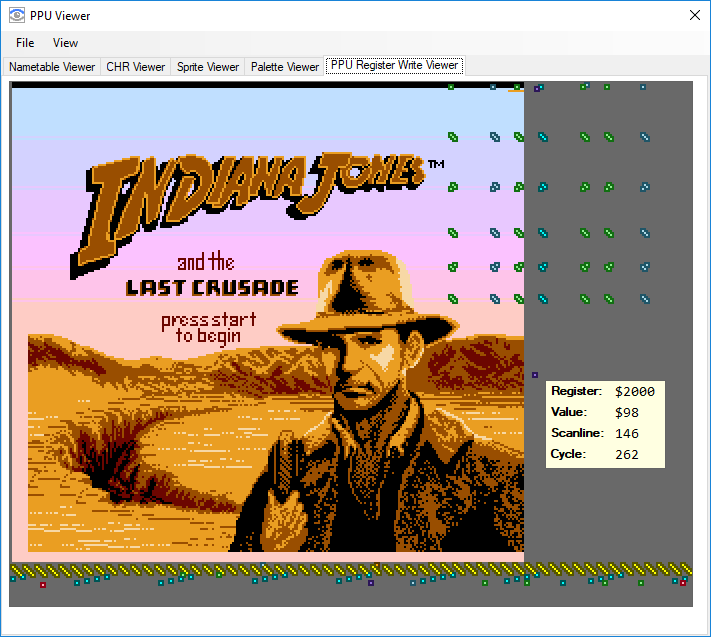
And speaking of register writes, a visualisation that shows this would be pretty awesome too. My current workflow is replacing my actual PPU register writes (to $2005/$2006) with PPU register writes that take the exact same amount of cycles but actually change the rendering, such as setting the monochrome bit along with one of the colour emphasis bits.
But this obviously requires me to switch back-and-forth between my debug code and tve actual code. It'd be great if this process of seeing a blended colour in the PPU output to visualise the time of the PPU register writes could be achived without having to change my code. Perhaps by making the output between the start/finish of a PPU register write result in a red/green/blue/other-distinct-colour-depending-on-which-register-is-written blended overlay.
Bananmos wrote:
And speaking of register writes, a visualisation that shows this would be pretty awesome too.
... oh, man, it would have been
awesome if something had automatically been able to make
this image rather than exactingly play with Nintendulator's debugger and breakpoints and marking up the screenshot in Gimp.
(Actually, I know that that image is inaccurate because there should be a bunch more pixels of that pinkish palette entry 0 on both left and right and the bottom too)
—
Is there a "breakpoint on write that would cause a bus conflict for those mappers that sometimes have bus conflicts " ? Maybe there's already enough rope to do that with breakpoint conditions?
This is easily the most complete set of debugging features I've ever seen in any emulator, so, good job! That being said, I can think of a few things that I personally would consider improvements:
- Put buttons for controlling the program flow in the debugger window itself: I have trouble remembering keyboard shortcuts (I'm much more of a mouse guy, really), and having to repeatedly go through the menu every time I need to run, break, step, etc. can be very tiresome. I know that the interface is already pretty cramped as it is, but if you could find a spot where to put these buttons, that'd make my day. It looks like there's some room left where the "Undo changes" and "Go To" commands are, so that's an idea... This is what I miss the most when comparing Mesen to FCEUX.
- Don't alternate the dot crawl pattern when drawing partial frames: I don't know how the NTSC filters integrate with the emulator, but would it be possible to alternate the dot crawl pattern only when an entire frame has been rendered, as is the case during normal gameplay? I get very distracted by the NTSC artifacts wobbling around when I'm stepping through the code trying to time raster effects and such. Plus it's not a very good representation of what happens with the real hardware.
- Add an option to show the previous frame under partial frames: This would help us know when the PPU is about to render an area of interest when we're stepping through the code, and would also make it easier to compare frame to frame changes (e.g. how much a raster effect jitters). The old frame could be dimmed, tinted, desaturated or something, so we could clearly see what's new and what's old.
- Add more options to the "Break in..." window: Frames, scanlines and CPU cycles would all be welcome additions. Of course we can convert those into PPU cycles manually, but it's much more convenient to have the program do it for us. A "break on scanline" option would be great too, but I guess we can just use a "scanline == XX" condition in a normal breakpoint already if we really need that.
I'm gonna say this again: What you currently have is already awesome, and I find it particularly cool that you're willing to hear from other developers and consider implementing the things that would improve their workflow. Keep up the great work!
Looking forward to trying this emulator out. By the way, does it have feature parity between the Windows and Linux veraions? FCEUX's lack of debugging features in the Linux version is one of the big reasons I'm still on Windows.
(Pro Motion is the other one, need to see how well Wine handles that nowadays...)
Thanks for the feedback!
A bit short on time to reply at the moment but:
-Adding ppu register writes to the picture should be easy, but I'm not sure how easy showing hblank would be (and then you might also want to show any register change occurring during vblank, too). I could probably add another tool that displays a 341x261 image showing dots (+ optional text?) for all register writes, though.
-Bus conflicts break: I haven't tested it, but I think something like this would probably work: "IsWrite && (Value & [Address]) != Value". So if the value written & the value stored at the address are not the same, the condition is true.
-Buttons in the debugger window: Would a toolbar at the top with most of the frequently used actions be good enough? This would allow me to easily add a toggle to hide/show the toolbar for people that wouldn't want it.
-Alternate ntsc dot pattern w/ draw partial frame: That's actually a bug, didn't realize it did that, should be simple to fix.
-Show previous frame under current frame (with dimming/etc): I think this might be possible, I'll check.
-More options in "Break in..": Sure, that's an easy change
Regarding Mesen under Linux: The debugger is identical in both versions - but the Linux version does require Mono to run. Beyond that, except for the lack of support for exclusive fullscreen, the Linux version should be identical to the Windows version.
Thanks again for the feedback, if anybody has anything else they'd like to see added, feel free to chime in!
Quote:
-Adding ppu register writes to the picture should be easy, but I'm not sure how easy showing hblank would be (and then you might also want to show any register change occurring during vblank, too). I could probably add another tool that displays a 341x261 image showing dots (+ optional text?) for all register writes, though.
Is it extending the image width that's posing the problem?
Thinking further, I could think this feature could come in two variants:
1) A separate window that shows a blank 341x261 image, with register writes in various colours (like the image lidnariq linked to), like you suggested
2) An ability to overlay this window on top of the usual rendered output, with some sort of simple blending
Now, if feature number 2 is restricted to the usual 256x240 output that's not a big problem, if you can view the hblank/vblank-specific parts using feature 1. And perhaps a merged view would be possible in a later version, when more people have tried it out in practice and can provide their own feedback.
I find I spend way too much time aligning my writes manually to fit in hblank when writing raster loops, and finally seeing a feature like this in a NES emulator would be pretty awesome.

Bananmos wrote:
Looking forward to trying this emulator out. By the way, does it have feature parity between the Windows and Linux veraions?
It should be, because it runs in Mono on my Debian 9 laptop.
Bananmos wrote:
FCEUX's lack of debugging features in the Linux version is one of the big reasons I'm still on Windows.
(Pro Motion is the other one, need to see how well Wine handles that nowadays...)
Wine handles FCEUX fine, and the devs are receptive to Wine bugs.
I too am looking forward to a PPU write visualizer.
Sour wrote:
-Buttons in the debugger window: Would a toolbar at the top with most of the frequently used actions be good enough? This would allow me to easily add a toggle to hide/show the toolbar for people that wouldn't want it.
Sure, sounds great! Anything that allows running/breaking/stepping with single clicks will work well IMO.
Quote:
-Show previous frame under current frame (with dimming/etc): I think this might be possible, I'll check.
It makes sense to make this optional as well, right? Maybe via a check box right after the one that enables the display of partial frames?
BTW, here's one more vote for the PPU write visualizer. Sounds like an incredibly useful feature!
One thing that I'd love to have built-in to a debugger (which I admit can currently be done with a lua script), is to have an option to log all writes to a certain address. I often want to figure out what all things are writing to a variable, and what they're writing, but if that variable gets used in a ton of places, it can be really inefficient to put a breakpoint on it and manually watch it -- instead I'd love to have a log of the writes, similar to running a trace, but limited to only writes to that one address.
So the ability to flag an address to log writes, and get a report like this (if I'm watching $0400)
$8023 : $FF
$8027 : $F0
$8347 : $00
...
etc
Where each line is a write to $0400, and tells the address of the command that wrote to $0400, and the value written to $0400
Does that make sense? Like I said, I can do this already using lua scripts, but I'd love to see it built-in to something. (or maybe it already is, and I've missed it)
Sooner a request for adding a feature to run half-cycle and show up all the results.  Why? Are you really taken all those things into account for massive debugging sessions, or a non-stop 48 hours journey of coding a new game? Nope, you are NOT.
 ANYWAY, a cool feature is the ability to run arbitrary code.

You type the code and push RUN. You open an ASM file (proprietary format) and push RUN. You load a CHR bank(s) file(s) and hit RUN. Plus, the ability to save your code.
Zepper wrote:
Sooner a request for adding a feature to run half-cycle and show up all the results. Why? Are you really taken all those things into account for massive debugging sessions, or a non-stop 48 hours journey of coding a new game? Nope, you are NOT. Apparently it is possible to advance the emulation with PPU cycle accuracy, meaning you can in fact run franctions of CPU cycles. Please correct me if I'm long.
Quote:
ANYWAY, a cool feature is the ability to run arbitrary code.
You type the code and push RUN. You open an ASM file (proprietary format) and push RUN. You load a CHR bank(s) file(s) and hit RUN. Plus, the ability to save your code.
Now I can't tell whether you're joking, but there is in fact an assembler where you can write/paste arbitrary code. FCEUX also has a debugged that can assemble code and patch the ROM with the results, that you can save to disk.
Yes, extending the 256x240 resolution is probably not something that can be done easily. I can easily draw the whole frame in another window & then add the writes over it, though. I'll give this a go later tonight, shouldn't be too hard to get done.
@gauauu You should already be able to do this in the trace logger using conditional logging. Try this condition: "IsWrite && Address == $400" - it should only log instructions that write to $400
@Zepper Like tokumaru said, Mesen can already step through the emulation on a ppu tick level. The built-in assembler can also be used to run arbitrary assembly code, edit any existing code in PRG ROM and save the modifications as a new rom or as an IPS patch, too. The CHR data can be edited in the PPU viewer and saved to a rom/ips file, too. There is no way to load assembly code or CHR data from external sources/other tools, though.
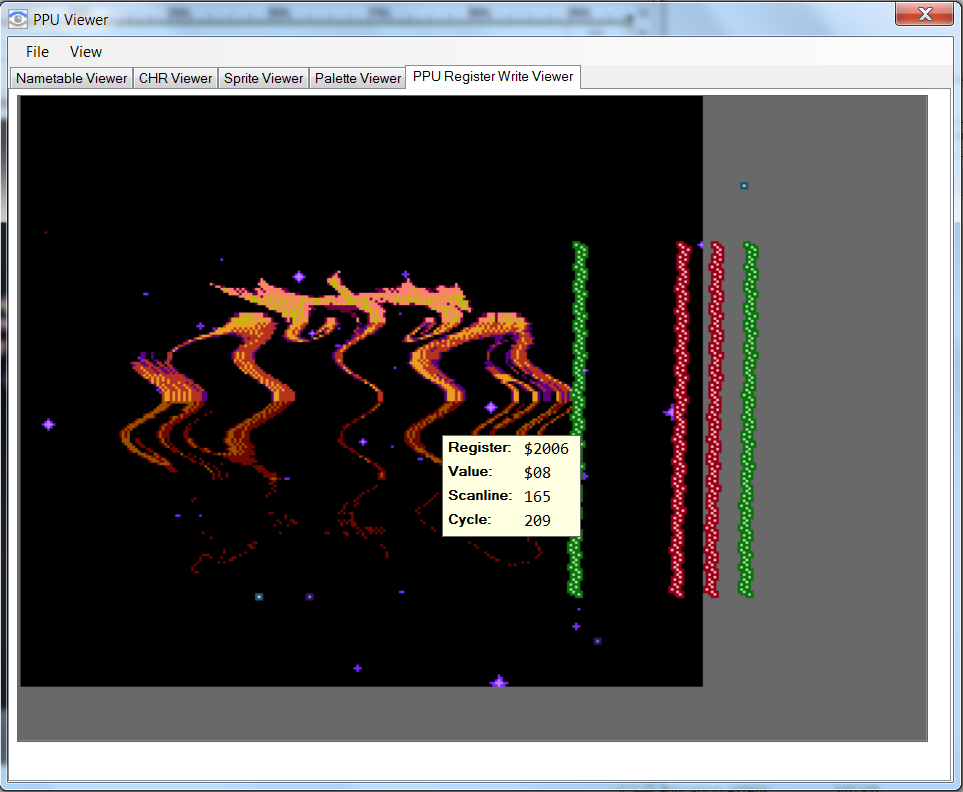
lidnariq's picture ended up being a great way of checking that it's working properly! The Sprite DMA is displayed as a series of writes to $2004, though.
Things I want to add:
-Mouse over tooltip on the dots to get precise info (cycle, scanline, register and value written)
-Ability to customize the colors (since it's impossible to pick colors that would be visible for all games)
-Maybe a list of all the writes and their info (e.g same as tooltip), but I want to avoid making the ppu viewer's window any bigger, so not too sure.
Any comments/suggestions?
Maybe it should show the left/right margins as the color from the expansion port (i.e. color 0) in concordance with the timing on
the scanline timing page? (i.e. 11 columns of backdrop immediately to the right of the visible field and 15/16 on the far right edge of the window)
What's the colorspace for the surface here? In RGB, XORing any number of component with 0x80 is guaranteed to be visible. Not certain what an equivalently useful metric would be in other colorspaces... and not that making it configurable is bad.
It looks like you've marked all the cycles a little to the right of my version. Did I forget to account the 10ish pixels of delay from when the
STx abs starts and when the write happens? Does the game vary from boot to boot? Are there subtle timing differences here between Nintendulator and Mesen?
Looks awesome, but how does it work over time? The scanline and cycle options at the bottom don't really apply to this screen, since this is not a snapshot of a specific moment, but the log of an entire frame. Also, since it's nearly impossible to sync the CPU with the PPU in a game, those annotations may jitter a lot when the emulator is running. I guess it's possible to keep the CPU debugger open and advance frame by frame to see this window in "slow motion", right?
I'm not against shifting the image to match the actual NTSC timings, but it seemed easier (for me) to see how much you need to shift your writes if the entire hblank is together on the right side? Personally I always see the scanlines as being 0 (blank), 1-256 (pixels), 257-341 (blank), even though that's not what's actually happening NTSC-wise.
And I did forget to keep a 1 pixel blank on the left side for cycle 0 which doesn't output a pixel (so everything in my screenshot is off by 1 pixel at least)
Didn't know about the XOR trick, that's good to know. Though in this case, if I XORed it with the background, then you'd have the problem of not knowing which register it represents without checking the tooltip.
The exact cycles seem to vary quite a bit from frame to frame (maybe +/- 20-25 ppu cycles or so?) - was it meant to be almost the same on every frame?
@tokumaru
It refreshes at ~15fps while the emulation is running. When breaking execution, it refreshes on every break/step (like the rest of the PPU viewer tools). Technically, the "Draw partial frame" behavior should probably be applied here too (because I clear out the list of PPU writes at the start of the frame, so if you break at scanline 120, you will only see writes for scanlines -1 to 120).
You're right that the scanline/cycle options at the bottom don't make sense in this case, I will probably hide them when the tab is active and hardcode it to refresh at the end of the frame when the emulation is running.
Sour wrote:
@gauauu You should already be able to do this in the trace logger using conditional logging. Try this condition: "IsWrite && Address == $400" - it should only log instructions that write to $400
Wow, you rock... Every time I need a feature, turns out it's already there and I just haven't discovered it. Again, thanks!
Sour wrote:
The exact cycles seem to vary quite a bit from frame to frame (maybe +/- 20-25 ppu cycles or so?) - was it meant to be almost the same on every frame?
I ... thought at the time that I made the diagram in Nintendulator that it was perfectly synced to the PPU, but I'm really not confident anymore.
I don't think anyone managed to achieve perfect PPU synchronization before blargg found out a way to do it. But even when things are perfectly sync'ed you can't really do pixel-perfect raster effects, since the smallest unit of time the CPU can control is equivalent to 3 pixels, so there will invariably be at least SOME jittering.
Wow, you're quick! That looks amazing and makes me drool already
I am a bit confused as to why it only shows a single dot for each scanline though? The actual write in an STx instruction should occur over a full CPU cycle if I'm not mistaken. And on NTSC that would correspond to 3 PPU pixels output. So I'd expect three dots to be visible rather than just one.
Is there a chance we could try a version of it out ourselves soon? I'd really like to run it through a few stress tests. For one thing, it'd be fun to re-visit my really old "Years Behind" demo with it. That one went through a lot of effort to align writes to be within hblank even when DPCM throws the timing off, but it's still not 100% perfect. Mainly because I wasn't yet aware of how each boot of the NES would create a different phase alignment between the PPU and CPU clocks.
Speaking of which, I think I have another feature request that might not be in yet... does Mesen emulate and/or let you control this semi-random alignment of CPU/PPU phase? If your hblank window is *really* tight (such as when changing a palette index and then restoring the full X/Y scroll value) you might need to reset your NES many times to check that your hblank code still works fine under all reset phases. And being able to explicitly reset to each phase would significantly shorten this labor.
One other very minor feature request (unless you've already done this and I just can't find it, like every other request I make):
The option for "break on power/reset" seems to be only available to select from within the debugger window. But if don't have that selected, and my game is crashing immediately at startup, I can't open the debugger to toggle that option.
My workaround has been to load a different game or an older working version of my game, open the debugger, toggle that option, then re-open my game (alternatively I could probably edit the config file directly). Is there a way (or can you add a way) to toggle that option from the "no game is loaded" view, or on the main window somewhere?
I think choosing the colors might not actually be necessary this way? Every color seems relatively easy to distinguish? And should still be visible against most backgrounds.
I've tried to add as much as I could here (and ended up making icons for the run ppu options to be able to put them too). Anything that seems to be missing?
Bananmos wrote:
Is there a chance we could try a version of it out ourselves soon?
I'm not quite completely done with the code just yet and out of time for tonight - I should be able to make a build with the changes tomorrow night though.
Bananmos wrote:
The actual write in an STx instruction should occur over a full CPU cycle if I'm not mistaken. And on NTSC that would correspond to 3 PPU pixels output. So I'd expect three dots to be visible rather than just one.
Technically, the "write" portion of the CPU cycle only lasts half a cpu cycle, iirc. So at most it'd be 1.5 PPU cycles? Either way, it's just simpler to represent it as it is in the emulation core. The CPU runs 3 PPU cycles before every CPU cycle (in the emulator), the dot where the write appears is the last PPU cycle that was competed before the write was performed. e.g: if the write is at cycle 30, then cycle 30 is done running, and the write occurred right before cycle 31 was run.
Bananmos wrote:
does Mesen emulate and/or let you control this semi-random alignment of CPU/PPU phase?
There is an option to not reset the PPU when resetting the console (to mimic the original famicom) in the emulation settings (advanced tab) - you can use this to change the alignment by resetting. (Because of recent changes, the reset trigger is only processed at scanline 240 cycle 0, so the PPU will always be on scanline 240 at the end of reset - it should still cause the PPU's alignment to change each time, though.). Alternately, you can also just edit the emulator's state & change the PPU's cycle manually - that should also do the trick.
gauauu wrote:
Is there a way (or can you add a way) to toggle that option from the "no game is loaded" view, or on the main window somewhere?
Even toggling the option won't work actually - unless the debugger window is opened, breakpoints are never triggered. What I could do is use the "Developer Mode" setting as a switch and force the debugger to open up automatically if the game is about to crash (by executing an invalid opcode) if dev mode is on - at that point you should be able to just reset the game and debug it normally.
Bananmos wrote:
I am a bit confused as to why it only shows a single dot for each scanline though? The actual write in an STx instruction should occur over a full CPU cycle if I'm not mistaken. And on NTSC that would correspond to 3 PPU pixels output. So I'd expect three dots to be visible rather than just one.
M2 is high for precisely 15/8 of a pixel, at least on NTSC. We still don't know what 2
CA07 or UA6527P duties are.
/PPUSEL (or whatever you want to call the signal going into PPU pin 13) should have that same signal, delayed by two gate times. Given that /ROMSEL is delayed about 30ns ... it's probably 50ns delayed, give or take? That's roughly one more master clock cycle.
Krzysiobal has stated that CPU bus is not necessarily stable by the time M2 rises—he's had to adjust timing in his hardware to latch things on a rising edge of /ROMSEL instead of a falling edge—and it seems likely that this could be related to the glitchiness of writes to $2003.
—
Oh, hey, I noticed (and forgot due to lack of frequent use) that I seem to be unable to specify a file from the command line?
I've often dreamed about some kind of a remote debugging protocol (probably over sockets) that would allow source-level debugging from an editor like Visual Studio Code by retrieving information about the registers and other stuff from the debugger, and by being able to control the emulator's execution (stepping, etc).
Consider this a very, very low priority request since I don't have any immediate use for it.
Sour wrote:
I think choosing the colors might not actually be necessary this way? Every color seems relatively easy to distinguish? And should still be visible against most backgrounds.
Looks OK to me. I guess we'll have to give this a try in different games to see how well the color scheme works in practice.
Quote:
I've tried to add as much as I could here (and ended up making icons for the run ppu options to be able to put them too). Anything that seems to be missing?
Looks great! The meanings of the PPU icons are very clear. I'm sure it'll be very handy to have all these options just one click away.
I was just now using Mesen and thought of a few more suggestions/requests:
- Add a "grayscale" option to the "Palette" dropdown in the CHR Viewer tab: This is so that we can see tiles clearly even when the game is flashing the palettes or they're all blanked out during transitions or something. Being able to force a grayscale palette (or maybe 4 different color gradients, so that the attribute information is still visible) on the Nametable viewer could be useful as well, so it's possible to analyze screen-drawing routines that run during screen transitions.
- Keep both "Freeze" and "Unfreeze" options (and possibly "Toggle"?) available in the Memory Viewer's context menu: It's not uncommon for me to freeze scattered addresses, so it would be very convenient if I could select a range containing multiple frozen addresses to unfreeze then all at once, but the way it is now, the "Unfreeze" option only appears if ALL selected addresses are frozen, so I have to either unfreeze one by one or freeze an entire range and then unfreeze it (I'm pretty sure that this last solution could have undesired side effects if the game was running though, since multiple unrelated addresses would be frozen for a while).
And now for another low-priority request: Would it be possible to graphically display the final waveform in the APU Viewer? I haven't done much audio coding for the NES yet, but I imagine it could be useful to step through APU update code and actually see how each write affects the output. Maybe this could be used to analyze cracks and pops or other problems that are difficult to hear.
EDIT: I just noticed that there's no mirroring information at all in the Nametable Viewer, and this is kind of a big deal, since mirroring greatly impacts how scrolling engines work, and there are a few special effects that make use of rapid mirroring switching... I don't see any room where to put the mirroring information though, so I can't really think of a good solution for this.
I just though of a way to handle the palette issues I mentioned in the last post (having palettes that are not affected by the game so that we can still see pattern and name tables even when the palettes are flashing or blank):
Add a set of alternate palettes after the 8 actual palettes the system has, pre-populated with grayscale, other gradients, or anything you see fit, but keep them editable just like the real palettes, so that users can setup their own alternate palettes if the built-in ones don't work for them (reversed brightness or something). Then, in the CHR viewer, you can pick "Alt. 0", "Alt. 1", "Alt. 2", etc. as the palette to display tiles with, and in the Nametable Viewer, you could check "Use alternate palettes" to use the first 4 alternate palettes instead of the real palettes.
What do you think?
lidnariq wrote:
Oh, hey, I noticed (and forgot due to lack of frequent use) that I seem to be unable to specify a file from the command line?
Is this with the latest commit or something that's older than a week or so? There was a bug in 0.9.4 due to paths getting forced to lower case in Linux, it should already be fixed though.
thefox wrote:
I've often dreamed about some kind of a remote debugging protocol (probably over sockets)
In theory, I guess this wouldn't be overly hard to create on the emulator side of things, but creating/maintaining the addon for it for VS Code and/or other IDEs would probably require a lot of time/effort. I'm not saying it'll never be a thing, but if it is, it probably won't be anytime soon :p
tokumaru wrote:
a few more suggestions/requests:
-Freeze/Unfreeze: I'll change unfreeze to be available whenever a frozen address is selected
-APU Viewer: I actually originally wanted to do this (displaying the wave form for each channel independently), but it turned out to be a lot trickier than I had anticipated (e.g would need to keep the output volume for every single channel on every single APU cycle in a buffer to be able to display it in the UI at different time scales, etc.), mostly because I didn't want to negatively affect Mesen's general performance, etc. I might try to get this done at some point in the future, though.
-Nametable mirroring: Technically, for the most part, you can visually see the mirroring info (and you can also see the exact nametable mappings at the bottom of the debugger window, too), but I could add a mirroring field to the NT viewer, too (someone else actually asked the same thing a few days ago, too)
-CHR/Nametable grayscale/custom palettes: I'll have to see about this - the palette viewer/editor is directly connected to the PPU's palette RAM, so adding custom palettes in there can't really be done as-is (I'd need another way to store the custom palettes, etc.). Preset palettes (e.g 4x 3 different shades of the same color + black) might be a little simpler to get done.
Sour wrote:
thefox wrote:
I've often dreamed about some kind of a remote debugging protocol (probably over sockets)
In theory, I guess this wouldn't be overly hard to create on the emulator side of things, but creating/maintaining the addon for it for VS Code and/or other IDEs would probably require a lot of time/effort. I'm not saying it'll never be a thing, but if it is, it probably won't be anytime soon :p
Yeah actually I was thinking that somebody else (like me) would be creating the VS Code (or whatever else other IDE) add-on. I might give it a go at some point.
I started making a VSCode extension for editing CA65 assembly code. I had syntax highlighting, hover to see the values of constants, and jump to definition implemented at least. I should dig it out and make it presentable for others to use. It parses the CC65 debug info file to provide all the information.
VSCode implements the language server protocol, which is a standard that many IDEs use, so with just a bit of glue it could integrate with a bunch of editors.
VSCode also has a debugging server protocol, which could plug into an emulator for live debugging using the source.
Would it be easier to implement VS Code's protocol for these things or GDB's?
Sour wrote:
Is this with the latest commit or something that's older than a week or so? There was a bug in 0.9.4 due to paths getting forced to lower case in Linux, it should already be fixed though.
It was, in fact, with 0.9.4-1-g423ac65a, so that makes sense.
Sour/lidnariq: Ah... yes, you're right that the actual part of writing during the cycle is smaller than 3 pixels.
And ~1.5 pixels is small enough that your current strategy of putting the register writes at a single pixel with an 'outline' in each direction should be good enough. Can't wait to try this feature out in practice!
I too would vote for GDB protocol integration to be the primary target *if* this gets implemented. GDB has been supporting this usr-case for a long time now, and even Visual Studio can use GDBserver.
Here's an updated build:
downloadChanges:
-Added PPU memory write viewer
-Added toolbar to debugger window (optional)
-Fixed "draw partial frame" issue with NTSC filters (toggling odd/even frame effect on each step)
-Added cpu cycles/scanlines/frames options in "Break In" dialog
-Added option to display the previous frame in grayscale under the current frame (for use with "Draw partial frame")
-Split "Freeze/Unfreeze" command into 2 commands to allow unfreezing areas where all bytes aren't frozen
-Added a "Mirroring Type:" read-only label at the bottom of the nametable viewer (will probably make this an editable field at some point)
Let me know if you feel like there's anything out of these that still needs tweaking.
Things left (soon?):
-Opening up debugger when the CPU crashes
-Custom/Grayscale/etc palettes for CHR/Nametable viewer
Ideas for the future:
-APU output graphs
-Remote debugging
Did I forget about something?
As far as remoting debugging goes, it seems like VS Code's protocol is specific to it, but it's meant to be used as a wrapper for other protocols (e.g you can wrap a GDB debugger in a plugin for VS Code's debugger, etc.) I guess GDB might make sense here, although I have absolutely zero knowledge of it. I'm happy to help on the emulator end of things if anyone wants to try to integrate the debugger into an IDE, just let me know.
Any more feedback/feature requests? :p
tepples wrote:
Would it be easier to implement VS Code's protocol for these things or GDB's?
Bananmos wrote:
I too would vote for GDB protocol integration to be the primary target *if* this gets implemented. GDB has been supporting this usr-case for a long time now, and even Visual Studio can use GDBserver.
From my experience the gdb remote protocol isn't quite as generic as you'd hope it to be and often makes some target-specific assumptions. Could be troublesome if gdb/gdbserver doesn't know about 6502. It was also very prone to other kinds of compatibility problems. I have limited experience though so might be mistaken here.
Anyway, I wouldn't make the emulator talk to VS Code directly. The VS Code protocol is very high level, so that would lead to duplicated effort in other emulators. Instead, the emulator would talk to the debug adapter (supplying register values, memory contents, etc.), and the debug adapter would talk to VS Code. Even if there are some problems, the gdb protocol might make sense for the emulator<->adapter communication.
So I've tried the latest build, and am just loving this visualisation!

...however, I seem to have a problem on my side where the tooltip won't appear when I hover the mouse over the register-write-pixels. Instead it seems to trigger about 1/4 of the screen to the left of it (and similarly for the Y position, I have to go up to find the tooltip).
YearsBehind_shifted_tooltip.png
Attachment:
File comment: Shifted tooltip in PPU writes
 YearsBehind_shifted_tooltip.png [ 136.83 KiB | Viewed 2235 times ]
Do you know what could be causing this misbehavior?
I also had a look at how the writes in the second part of Years Behind are affected by the DPCM, and am... somewhat surprised. As they appear to be very badly out-of-sync whenever DPCM plays.
Here's a few screenshots:
YearsBehind_exploder.png
Attachment:
 YearsBehind_Exploder.png [ 135.41 KiB | Viewed 2235 times ]
- This is the original tune by Chibi-Tech with no DPCM playing, so all bars are almost perfectly vertical save for the 2/3 cycle/scanline oscillation, as expected.
YearsBehind_gradius.png
Attachment:
 YearsBehind_Gradius.png [ 145.83 KiB | Viewed 2235 times ]
- This is how the demo looks while playing the "Gradius" cover by Memblers. The bars are no longer nicely vertical, which is expected. But the big shift to the right is not.
YearsBehind_Hyperspace.png
Attachment:
 YearsBehind_Hyperspace.png [ 149.33 KiB | Viewed 2235 times ]
- This is is how it looks while playing the "Hyperspace" cover by Memblers. It's even worse, and besides the big shift to the right of the PPU register write debug pixels there's also corruption on the bottom part of the blue blob.
Now, it was a long, long time since I wrote this code and memory is a bit vague in the details, so it's not impossible I did mess this approach up in the end. But I do distinctively remember spending loads of hours adjusting the fractional phase accumulator for each of the 16 sample playback rates, in order to make my set-unset-monochrome-bit debug bar look as vertical as possible even when DPCM samples were playing. I don't think I got it "perfect" as I was just observing a fuzzy and jittering bar, but it did look a lot more closer to vertical than what I'm now seeing in Mesen's PPU Write visualiser.
And the demo also seems to glitch a lot more in Mesen than it does on a real PAL NES (where there is just an occasional very subtle glitch on the scroll text, about once every half a minute. And which I think will only happens if you're unlucky with the reset phase, IIRC.
So I am wondering if Mesen could possibly have the DMA cycle steal slightly wrong for PAL machines? As I'm on vacation I can't really confirm this by trying the debug-thing on my real PAL NES. But I'll see if I can get some hacked debug code to test with other emulators tomorrow and see what they show. (and if anyone else has a PAL machine+powerpak+free time I'd be eager to find this out)
Thanks for testing!
The tooltip issue is most likely related to you having DPI set to over 100% in Windows. I'll take a look.
Mesen's PAL emulation (and I'd even be tempted to say every emulator's PAL emulation) is probably not as robust as NTSC, so I wouldn't be too surprised if there are some issues. There are few PAL test roms, and most of them only test relatively basic behavior. Does the PAL version have any known difference in behavior vs DMC cycle stealing? Mesen implements this as stealing 4 cycles normally, and 3 cycles if it lands on the last cycle of a write instruction ($4014-related quirks aside) - I tried tweaking it to always steal 3 cycles, but then the bars end up shifting more and more to the left (instead of the right).
Having the ability to easy invoke the debugger from the main game window would be nice.
To kill 2 birds with one stone, the way to get remote debugging is to have a "monitor" as you can easily run it over a telnet interface which allows for external debuggers.
Attachment:
 remote.png [ 48.02 KiB | Viewed 2155 times ]
it also makes it easier to set up breakpoints, compare memory, set traces etc although when you only have 2K probably not that much need

having an IO command that lets you see the hidden internal state of things is also handy. And having it in text spares you from having to make a custom GUI for every mapper under the sun
having "debug borders" is a great addition btw
Thanks for the new features, Sour! The PPU Writes Viewer is pretty cool, not only for checking out raster effects, but also vblank handlers!
I'm dying to get some free time to really test the workflow on this! Looks amazing!
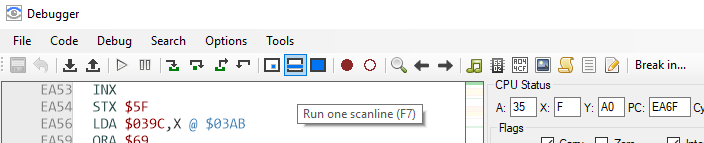
I got a bug when quick testing though. It was mid-scanline and I hit "run one frame" and this happened. Granted, I had no idea what I was doing this for, much like random testing of buttons.
https://imgur.com/a/hTZAW
Quote:
The tooltip issue is most likely related to you having DPI set to over 100% in Windows. I'll take a look.
Indeed that was the issue. I've changed my 125% setting to 100% and the tooltip now appears in the right spot. I have had the 125% setting since forever though, so it's a bit of a bummer to have to revert it. But if there's no other way then I'll switch just for this cool new debugging mode
I've hacked the Years Behind demo to replace the scroll writes in the second part with the set/unset monochrome-bit&intensify-blue sequence i originally used when building the DPCM adjustment table back in 2003. And it consistently shows the same shearing in Mesen, FCEUX and Nintendulator. Which makes me suspect that maybe I'm the one who got things a bit wrong after all. But in that case, it's still a bit of a mystery as to why the glitches are so much worse in the emulators than on a real PAL NES.
I'll make sure to run this debug version on my PAL NES when I'm back from vacation. But if anyone else with a PAL NES and flashcart wants to beat me to it, it's available
here.
Nice to hear that people are finding it useful!
nesrocks wrote:
I got a bug when quick testing though. It was mid-scanline and I hit "run one frame" and this happened.
https://imgur.com/a/hTZAWThanks for the screenshot! Allowed me to figure out the problem in all of 5 seconds.
Bananmos wrote:
I have had the 125% setting since forever though, so it's a bit of a bummer to have to revert it.
No need, it's fixed :) High DPI modes are meant to work (I spent a couple of days fixing DPI issues in the interface in version 0.9.4), but it's something that constantly needs to be tested. And since testing requires firing up a Windows VM with higher DPI (or rebooting my computer), I don't do it that often :p
As far as PAL goes, it's possible there might still be some quirks about the PAL NES that are not known. As far as I know, Mesen implements all of the PAL NES' known differences vs NTSC (at least, those I am aware of), including the slightly bigger window where sprite DMA can be performed, etc.
Both issues should be fixed in this build:
download Let me know if you find any other issue.
Oziphantom wrote:
Having the ability to easy invoke the debugger from the main game window would be nice.
What do you mean by this? There are customizable keyboard shortcuts to open all of the debugger tools (and enabling "Developer Mode" adds a "Debug" menu to the main window, for easier access to the tools, too)
Quote:
No need, it's fixed
Thanks! I can confirm it works on my side too
Oh, and another small issue: As Tokumaru mentioned, the ppu write visualisation can be really useful for studying the vblank write patterns as well - especially to catch the typical error of your vram writes ending up outside of vblank.
But I noticed that Mesen currently always has the window be 262 scanlines. Could we get the full 312 scanlines for PAL?
And thinking further, I think this kind of visualisation could be really good for other types of hardware-related events as well, such as getting those dots where the vblank NMI occurred, where the sprite#0 hit got set, and where an IRQ occurred.
Even better if it could be slightly configured too, kind of like a generic conditional breakpoint but with it adding to the visualisation instead of interrupting your program. (Pardon the feature creep...
The feature's scope was starting to get a bit too big, so I split it out of the ppu viewer and gave it its own window:
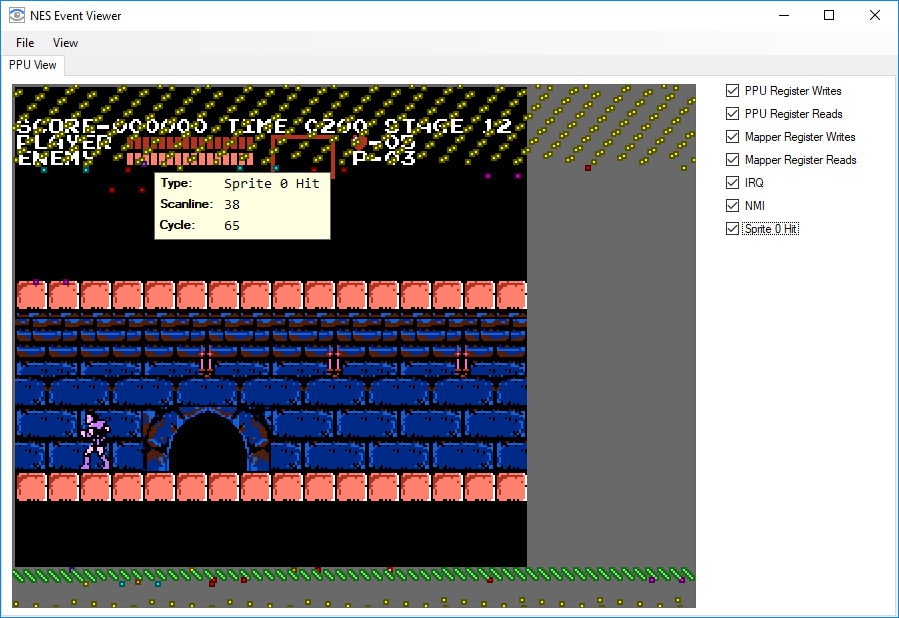
I moved the prerender scanline to the top of the screen, and made it so it adjusts the picture based on NTSC/PAL (and it will also add more lines if more were added via the overclocking options).
I'm probably going to add color customizations at this point - too many different things can be shown to pick a decent default palette.
Maybe 1 color for each ppu register (different colors for read/write, so ~10 colors?), and then 5 more colors: mapper register writes, mapper register reads, nmi, irq & sprite 0 hit.
Did I miss something obvious w/ regards to the categories of events someone might want to see on the image? (I excluded sprite DMA since it triggers a bunch of very visible $2004 writes already)
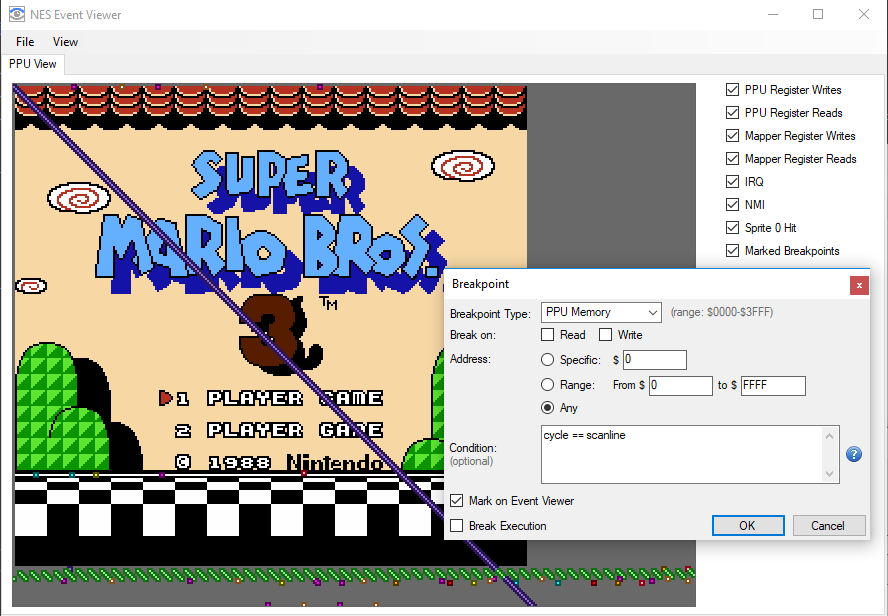
Adding conditional expressions to mark specific points on the screen would be possible, but having to add a bunch of UI just to add/delete/edit those is kind of annoying. I could add a fixed number of "condition" text fields to the window and have each condition display in a different color easily enough, though. Keep in mind conditionals are mean on performance (esp. since in this case they would need to be evaluated on every PPU cycle, instead of every CPU cycle) - each condition will probably each drop max FPS by 5-10%.
I'd suggest ability to place a mark at a particular CPU read or write location, as a way of visualizing CPU use. If you're worried about UI to make them, you could toss them in with the breakpoint setting UI.
[ ] Stop execution
[ ] Mark on Event Viewer using this color:
Yea, that turned out to be the best way to do it, thanks for the idea!
I had to make some changes to breakpoints, so I'll need to test things out a bit more, but for now it's working.
Still need to get color customization done, too.
Attachment:
 eventviewer2.png [ 44.92 KiB | Viewed 2157 times ]
Quote:
Maybe 1 color for each ppu register (different colors for read/write, so ~10 colors?)
Well, there's very few registers in the NES that are both read/write. Of the PPU ones there's only $2007/$2004, and reading those is of limited value and only done by a handful of games.
And given that the number of easily distinguishable colours are somewhat limited, I'd be tempted to say that distingushing reads and writes is perhaps not the best use of them?
I count a total of 12 different functions on the PPU's CPU interface:
$2000w, $2001w, $2002r, $2003w, $2004r, $2004w, $2005a, $2005b, $2006a, $2006b, $2007r, $2007w
(Visual2c02 shows the same 12—look near node #396)
Failing to distinguish read vs write only saves you two. Failing to distinguish first vs 2nd also only saves you two.
The 12 evenly-spaced colors around the edges of the RGB color cube are fairly easily distinguished: 1 2 3 4 5 6 7 8 9 A B C
although you may wish additional colors for "breakpoint" and for "reads/writes to non-extant registers"
lidnariq wrote:
The 12 evenly-spaced colors around the edges of the RGB color cube are fairly easily distinguished: 1 2 3 4 5 6 7 8 9 A B C
Though I'd probably number the colors differently for consistency with how color numbers are interpreted in the reset of Mesen:
1 2 3 4 5 6 7 8 9 A B COr to keep them from being oversaturated:
1 2 3 4 5 6 7 8 9 A B C
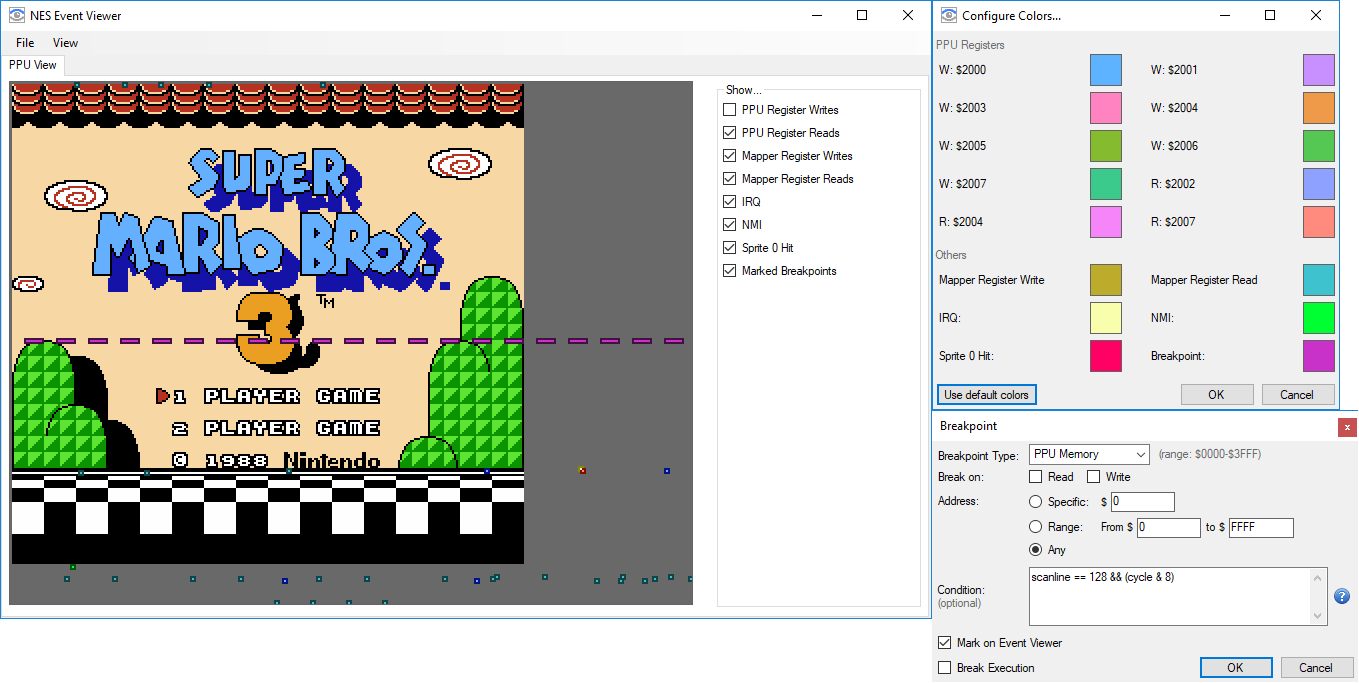
I ended up pretty much half-randomly assigning the default color palette. It's more or less impossible to come up with something perfect considering there are 16 colors to select at the moment. If anyone comes up with something that's better, feel free to post a screenshot of the color setup window & I can update the defaults to match.
Distinguishing the 1st/2nd write on the PPU registers that use them would be possible without too much effort, I think, if that's something that would make sense. Could also add APU register read/writes (as 2 colors) - I'm not sure there is much of a reason to do so, though? Can be achieved via the breakpoint marking functionality if really needed, too.
Overall, it looks like this now:
Attachment:
 eventviewer3.png [ 60.7 KiB | Viewed 2115 times ]
Build with the latest changes:
download (Windows-only to save myself a bit of time)
Let me know what you think.
Edit: Forgot to actually upload the build, fixed!
People may have different opinions on this one, but I don't think there's much point in distinguishing the 1st/2nd write to $2005/$2006. In normal circumstances it should be obvious that you're doing a double-write. And when it's not the tooltip should suffice.
I kind of liked the older default colour scheme better as writes to $2005/$2006 are much harder to distinguish now. But now that the default can be changed I can just change it back to my liking, so just figured I'd mention it in case you like feedback on the defaults.
The latest version does seem to have a bug on my side though: It only shows the PPU writes for a partial frame. See this screenshot from Years Behind again:
Attachment:
 YearsBehind_missing_ppuwrites.png [ 50.81 KiB | Viewed 2106 times ]
I was thinking it might be running into some fixed limit for the number of events per frame? But unticking certain events seems to have no effect either.
For my own edification, I've marked up your screenshot there, adding what the sync, colorburst, and (NTSC-only) overscan would look like:
Attachment:
 eventviewer3_sync_marked.png [ 4.67 KiB | Viewed 2102 times ]
Now that I've actually done this... yeah, I can see it's not particularly useful. Although
maybe some kind of ruler during hblank might possibly be...
Bananmos wrote:
writes to $2005/$2006 are much harder to distinguish now
[...]
I was thinking it might be running into some fixed limit for the number of events per frame? But unticking certain events seems to have no effect either.
Whoops, didn't even notice both $2005/2006 had similar colors. I'll try to come up with something more reasonable - at the moment it was pretty much selected on a "I want to get this done tonight" basis :p
And your assumption is correct, actually there is a limit of 1000 "events" logged per frame. The display options do not affect the limit, either. 1000 was probably plenty when only writes were being logged, but with all the new things getting logged, it's clearly not enough. I'll switch it to being dynamic with no hard limit, instead.
lidnariq wrote:
Although maybe some kind of ruler during hblank might possibly be...
Not too sure I'm understanding what you mean - maybe adding an optional grid every X clocks would do it? Slightly unrelated, but I was also thinking of changing the background color for the scanlines where it is safe to run the sprite DMA (which is slightly different between PAL & NTSC, afaik)
At least the sync column is useful to tell where the final $2005 write falls relative to v_vertical=t_vertical on the pre-render line, which happens continuously during the sync pulse between that line and the first picture line.
Bananmos wrote:
People may have different opinions on this one, but I don't think there's much point in distinguishing the 1st/2nd write to $2005/$2006.
I disagree. There are tricks involving mixed $2005/$2006 writes (such as mid-screen scroll changes or even
this) that may make the order of the writes significantly harder to distinguish. There's also the case when the first write is done in advance for timing reasons so there may be a large gap before the second write.
Quote:
And when it's not the tooltip should suffice.
It doesn't look like that information is in the tooltip yet, though... but yeah, that'd be a good place to put it.
Quote:
I disagree. There are tricks involving mixed $2005/$2006 writes
Good to see some debate
I'm not saying it's not useful at all, just that I'm not sure the this-is-the-first-or-second-write information needs to be that much in-your-face to warrant colour coding it, if the colour space is limited. The screenshots I posted also mess with the latch order as it's doin a $2006/$2005/$2005/$2006 sequence. But I think the green-red-red-green pattern communicates that well enough in the picture.
Anyway, with configurable colours I could always set both writes to look the same, so I don't particularly mind if it does get distinguished...
And nice trick with avoding the first address write, btw
I was disagreeing that the distinction is trivial for a human to make, but I actually agree that using different colors for that is overkill and could even cause confusion. Having that information in the tooltip would be cool though. I should've been more clear.

Some improvements/fixes:
-Changed default color palette - should be better than before (but there is still some overlap between colors)
-Fixed 1k event limit - there should be no upper limit anymore (tested with up to ~90k events on a single frame)
-Improved the UI's refresh performance and set the FPS limit to ~30fps instead of ~15.
-Added lines to delimit the start of NMI, the last "safe" scanline where sprite DMAs work properly and when stepping in the code, it will also display the current scanline (to indicate that anything below that line will be empty)
-Tooltips for writes to 2005/2006 now have a "2nd write" flag
-Tooltips for breakpoints now display info on the breakpoint (type, address range, condition)
-It is no longer necessary to open the main debugger window for breakpoint markers to show up on the event viewer
-Added a "marker" column (abbreviated to "M") in the breakpoint list that contains a checkbox - it can be clicked to quickly mark/unmark a breakpoint (without having to open the breakpoint edit dialog)
...I think that's it. Only improvement ideas I have left at the moment would be to add another tab with a list view of all the events, in the order they occurred and maybe some option to display a grid over the image (e.g maybe every 8 pixels or such). Let me know if there's anything else that could still be improved/added.
Windows-only build:
download
Thanks! Tried the new build, and all events now show
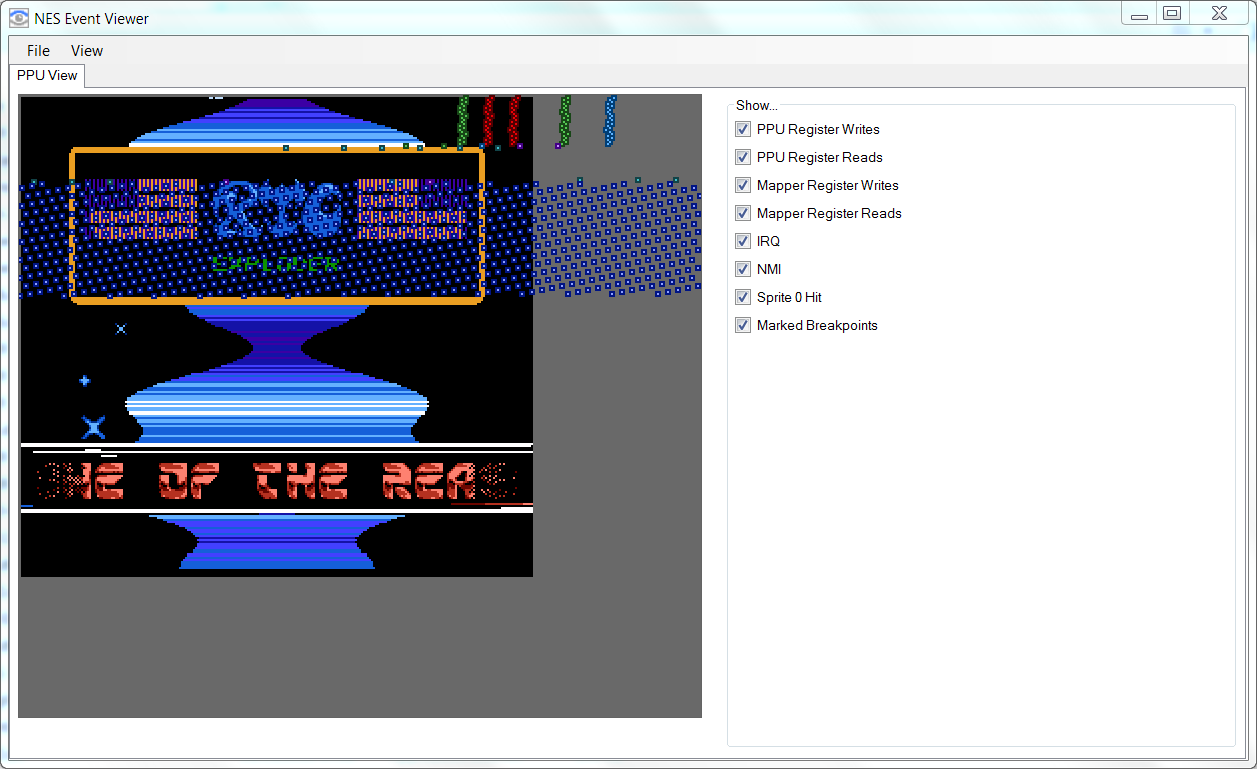
I figured I would take a closer look at the debugger, and ran into a few issues:
First of all, it looks like I cannot set any breakpoints. Clicking (with either the left or right mouse button) in the "breakpoints" list box just brings up this message box:
Attachment:
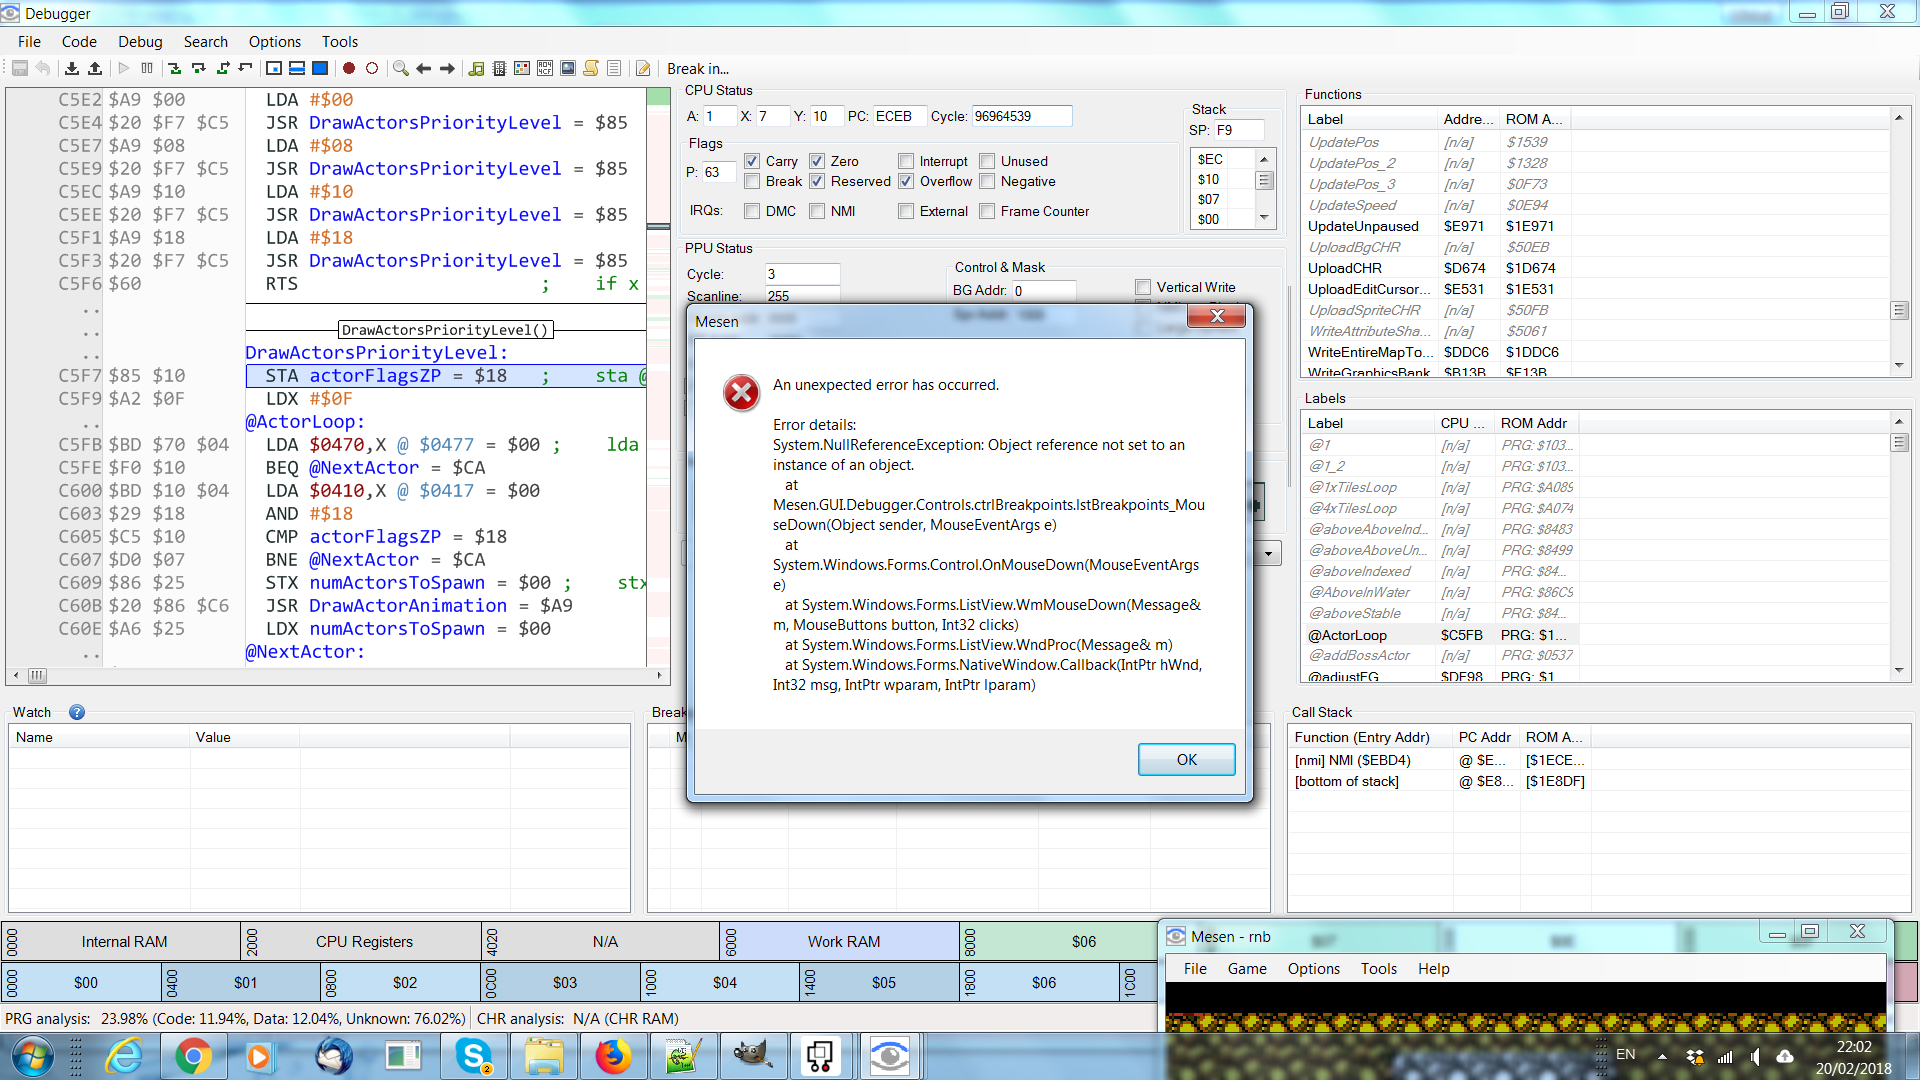 DebuggerCrash.png [ 405.21 KiB | Viewed 1970 times ]
Furthermore, I figured I would try out the CA65 .dbg file support. And while it mostly works out-of-the-box, some of the results are a bit confusing. Although a disclaimer is in place: I'm not at all familliar with CA65's .dbg files, or how much of the following "bugs" could just be limitations in this format, or bugs in ca65 rather than Mesen.
Anyway, the following code in my .asm file:
Code:
DrawActorsPriorityLevel:
@priorityLevel = actorFlagsZP ; unused by draw routine
sta @priorityLevel
ldx #MAX_ACTORS-1
@ActorLoop:
lda actorAddrHi,x
beq @NextActor
lda actorFlags,x
and #ACTOR_PRIORITY
cmp @priorityLevel
bne @NextActor
stx TEMP+14
jsr DrawActorAnimation
ldx TEMP+14
@NextActor:
dex
bpl @ActorLoop
rts
Ends up looking like this in Mesen's debugger:
Attachment:
 DrawActorsPriorityLevel.png [ 72.49 KiB | Viewed 1970 times ]
A few problems with these annotations:
1) Rather than showing the original "sta @priorityLevel"/"cmp @priorityLevel", these are shown with the actorFlagsZP variable instead. Now, @priorityLevel is just a local alias for actorFlagsZP, so this isn't a terrible behaviour. But what is curious is that the sta shows the original source-line statement (sta @priorityLevel) as a comment after the line, while the cmp does not. So I am curious what this inconsistency comes from?
2) Similarly, the original "lda actorAddrHi,x" statement is shown as a comment after the "LDA $0470,X" statement, while the "lda actorFlags,x" statement does not appear after the "LDA $0410,X" statement. And I see no reason why they should differ - both are originally allocated with a ".res MAX_ACTORS" statement.
3) "numActorsToSpawn" appears out of nowhere, when the source code actually just refers to TEMP+14. numActorsToSpawn is indeed aliased to the TEMP+14 location in a totally different subroutine "LoadMap". (declared with .proc/.endproc) But the fact that LoadMap uses it for this purpose is totally irrelevant here, and very confusing.
4) Even more strange is that the "RTS" statement gets a "YIELD" comment. YIELD is a conditional macro that calls a few sub-routines in my code, and the exact sequence depends on another constant "ACTORCLASS".
Code:
.MACRO YIELD
.IF (ACTORCLASS = BLOCK_ACTOR)
jsr BlockActorYieldSub
.ELSEIF (ACTORCLASS = BLOCK_ACTOR_ATTACHED_TOP)
jsr BlockActorAttachedYieldSub
jsr ReadjustBlockActorAttachedTop
.ELSEIF (ACTORCLASS = CONSTRUCTION_ACTOR)
jsr ConstructionActorYieldSub
jsr ReadjustY
.ELSE
jsr AnimatedActorYieldSub
.ENDIF
.ENDMACRO
...but no matter what ACTORCLASS is set to, the YIELD macro never compiles to just an RTS. So I really don't see where this association that "RTS" == "YIELD" would come from?
And another odd mystery is that this code:
Code:
.macro WRITE_CHRPAGE page
ldy #11
@loop:
lda (NMITEMP),y
tax
.repeat 16,i
lda page+$100*i,x
sta $2007
.endrep
dey
bpl @loop
.endmacro
.SEGMENT "DRAGONCHR"
.align $100
dragonCHR1:
.incbin "dragon1.rhc"
dragonCHR2:
.incbin "dragon2.rhc"
.align $100
dragonCHR3:
.incbin "dragon3.rhc"
WriteChrPageDragon1:
WRITE_CHRPAGE dragonCHR1
rts
WriteChrPageDragon2:
WRITE_CHRPAGE dragonCHR2
rts
WriteChrPageDragon3:
WRITE_CHRPAGE dragonCHR3
rts
...results in the code in Mesen looking like so:
Attachment:
 WriteChrPageDragon1.png [ 120.68 KiB | Viewed 1962 times ]
Attachment:
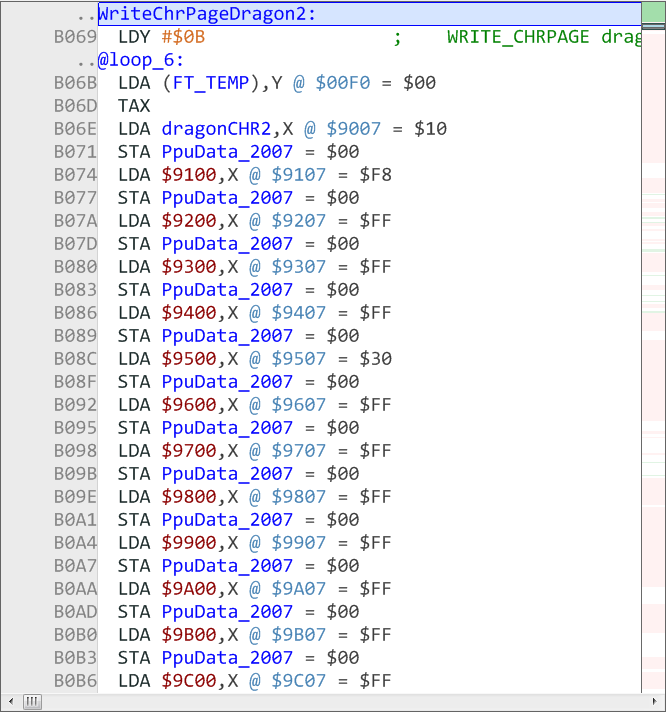 WriteChrPageDragon2.png [ 125.58 KiB | Viewed 1962 times ]
Attachment:
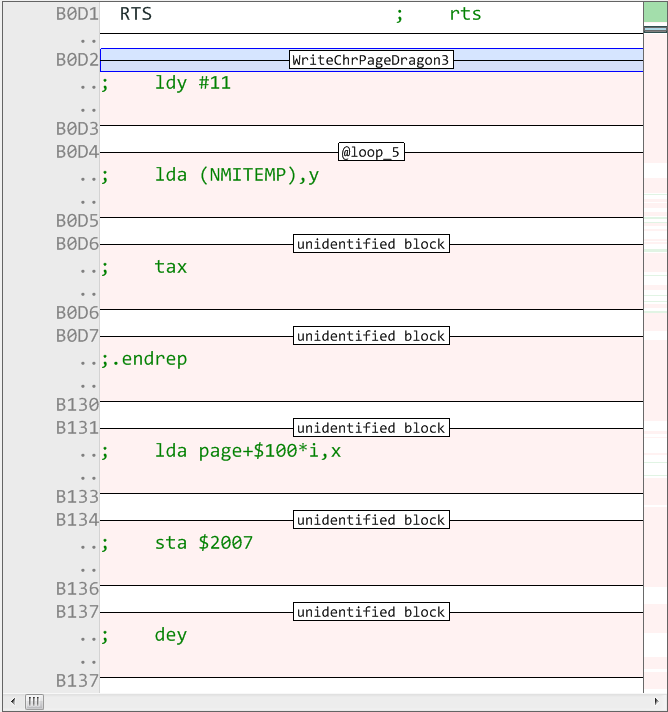 WriteChrPageDragon3.png [ 41.43 KiB | Viewed 1962 times ]
Or in other words, two of the three macro expansions show up expanded, while the third one results in the macro body embedded as comments.
Bananmos wrote:
it looks like I cannot set any breakpoints
Whoops, that's because of the "Marked" column I added last night - I'll get it fixed after work.
About the DBG file support - Mesen doesn't support local aliases (it has no concept of scope), so you can't assign multiple names to the same RAM locations and have them show up as different names throughout the code. As far as I know, the DBG file does provide that information, though, so adding support for it would be possible eventually. This should mostly explain 1 & 3.
For 2 & 4, it's been a long time since I coded the CA65 support, so I don't quite remember the conditions for it to display a comment - I'll have to check.
Ideally, having the rom, dbg file & source files would be ideal to be able to debug this one, if you're willing to share them, feel free to PM them to me.
Edit: To answer your edit about the 3rd macro: Mesen by default only disassembles code that the CPU has actually executed. There are options to change this though. In this case, I would assume the first 2 were executed while the debugger was running, but not the 3rd, which is why it's collapsed (light red background = sections that have not (yet) been used as either code or data) . Mesen uses CDL files to track the data/code segments - it's possible that the .dbg files contain enough information to produce a complete CDL file, I'd need to check.
Thanks for your quick response - yes, I figured there'd be a limitation on the ability to have the right local labels and such, and am kind of fine with that. But what's really confusing is how arbitrary this becomes in practice, with local labels form different functions showing up in the another one. And the fact that sometimes it does show variable names, and sometimes just raw addresses and I fail to grasp where the distinction comes from. Something with the ordering in the .dbg file maybe?
About the rom/dbg/asm files, it is a rather large project with a lot of assets, build-tools and game-specific things involved which I'm a bit hesitant to share in full. But I understand not having access to it will make reproing the issues difficult on your side. I will attempt to make a sensible and complex enough subset from the project, which builds smoothly and shows the issues I've seen so far.
And by the way, is there a way to make the "Profiler" refresh continuously rather than requiring a click on the "Refresh" button? The Profiler looks really useful, but for the case when time spent in functions can vary heavily based on the player's actions, it would be useful to see it update in real-time while playing the game.
Quote:
Edit: To answer your edit about the 3rd macro: Mesen by default only disassembles code that the CPU has actually executed. There are options to change this though. In this case, I would assume the first 2 were executed while the debugger was running, but not the 3rd, which is why it's collapsed. Mesen uses CDL files to track the data/code segments - it's possible that the .dbg files contain enough information to produce a complete CDL file, I'd need to check.
Ah, yes that was it. Triggering the event that causes the third CHR-RAM page to be written fixed the problem so that the third macro invocation now looks the same. But yeah, it'd be useful to have some way to remove this distinction between executed/not executed code.
Bananmos wrote:
And by the way, is there a way to make the "Profiler" refresh continuously rather than requiring a click on the "Refresh" button?
The list control is pretty slow to refresh since it can contain hundreds of lines potentially. I could have a very slow auto-refresh feature if you need one (e.g every second or half second maybe?) That should be fast enough in this case?
Bananmos wrote:
But yeah, it'd be useful to have some way to remove this distinction between executed/not executed code.
Check Options->Disassembly Options->"Disassemble..." and "Show...", it should be flexible enough for most use cases. You can also manually mark bytes as code/data/unknown by right-clicking in the code window or the memory viewer
A few more changes/fixes:
-Added a "Break on CPU Crash" option that will force the debugger to open and break the execution when the CPU executes an operation that will cause the CPU to halt. (to solve gauauu's use case)
-Added options to use a hardcoded 4-color grayscale palette in the Nametable & CHR viewers (subset of the functionality that tokumaru requested).
-Improved breakpoint display in the margin (added symbols to show when a breakpoint is conditional, or when the "mark" option is enabled)
-The profiler now auto-refreshes based on the memory tools' auto-refresh setting (at 0.1x the rate listed, so 6/3/1 fps)
-Fixed crash in the breakpoint list
-Fixed an evaluation bug with expressions (conditionals/watch expressions) when using parentheses.
I didn't check the DBG import issues yet, though.
Build here:
download
Sour wrote:
-Added options to use a hardcoded 4-color grayscale palette in the Nametable & CHR viewers (subset of the functionality that tokumaru requested).
Nice! Works great, thanks!
Tonight, I've started trying to switch to Mesen (Feb 19 version from this thread) from FCEUX for development purposes and have run into the following pain points so far. Apologies if any of these are already solved by existing functionality that I missed.
- Left- or right-clicking in the breakpoint region of the debugger gives me the exception below.
System.NullReferenceException: Object reference not set to an instance of an object.
at Mesen.GUI.Debugger.Controls.ctrlBreakpoints.lstBreakpoints_MouseDown(Object sender, MouseEventArgs e)
at System.Windows.Forms.Control.OnMouseDown(MouseEventArgs e)
at System.Windows.Forms.ListView.WmMouseDown(Message& m, MouseButtons button, Int32 clicks)
at System.Windows.Forms.ListView.WndProc(Message& m)
at System.Windows.Forms.NativeWindow.Callback(IntPtr hWnd, Int32 msg, IntPtr wparam, IntPtr lparam)
- Trying to set a breakpoint on $2000 with the condition $E3 == 00 gives me the error below. This seems to be related to the condition I used, since a breakpoint on just $2000 is created without issue.
An unexpected error has occurred.
Error details:
System.AccessViolationException: Attempted to read or write protected memory. This is often an indication that other memory is corrupt. at Mesen.GUI.InteropEmu.DebugSetBreakpoints(InteropBreakpoint[] breakpoints, UInt32 length) at Mesen.GUI.Debugger.BreakpointManager.SetBreakpoints() at Mesen.GUI.Debugger.BreakpointManager.AddBreakpoint(Breakpoint bp) at Mesen.GUI.Debugger.Controls.ctrlBreakpoints.mnuAddBreakpoint_Click(Object sender, EventArgs e) at System.Windows.Forms.ToolStripItem.RaiseEvent(Object key, EventArgs e) at System.Windows.Forms.ToolStripMenuItem.OnClick(EventArgs e) at System.Windows.Forms.ToolStripItem.HandleClick(EventArgs e) at System.Windows.Forms.ToolStripItem.HandleMouseUp(MouseEventArgs e) at System.Windows.Forms.ToolStrip.OnMouseUp(MouseEventArgs mea) at System.Windows.Forms.ToolStripDropDown.OnMouseUp(MouseEventArgs mea) at System.Windows.Forms.Control.WmMouseUp(Message& m, MouseButtons button, Int32 clicks) at System.Windows.Forms.Control.WndProc(Message& m) at System.Windows.Forms.ToolStrip.WndProc(Message& m) at System.Windows.Forms.ToolStripDropDown.WndProc(Message& m) at System.Windows.Forms.NativeWindow.Callback(IntPtr hWnd, Int32 msg, IntPtr wparam, IntPtr lparam) at System.Windows.Forms.UnsafeNativeMethods.DispatchMessageW(MSG& msg) at System.Windows.Forms.Application.ComponentManager.System.Windows.Forms.UnsafeNativeMethods.IMsoComponentManager.FPushMessageLoop(IntPtr dwComponentID, Int32 reason, Int32 pvLoopData) at System.Windows.Forms.Application.ThreadContext.RunMessageLoopInner(Int32 reason, ApplicationContext context) at System.Windows.Forms.Application.ThreadContext.RunMessageLoop(Int32 reason, ApplicationContext context) at Mesen.GUI.Program.Main(String[] args)
- Write breakpoints on the CPU memory range $2000-2007 don't seem to actually trigger. This is definitely counter to my expectations. Is there really no way to break on PPU register writes?
- Both pausing and unpausing (currently mapped to escape) with the debugger open cause focus to change to the debugger window, and unpausing doesn't actually work (the emulator seems to run one instruction). I have the debugger configured not to break when opened or in focus.
- If the emulator is paused and the debugger is opened or closed, the emulator unpauses. Again, I have the debugger configured not to break when opened or in focus.
- The emulator can pause when in the background, but this even happens when the emulator's own tool windows are in focus, which seems like a problem when trying to use things like the event viewer. Is there a setting to treat these like the emulator window for the purposes of background status?
- When loading a game, the onscreen display tells me the emulator is applying a patch that doesn't (to my knowledge) exist, which made me have to double check that there was no patch by that name. For development purposes, I'd like to know that the ROM I loaded isn't being modified by the emulator, but I might still want this auto-patch feature for casual play. Can Mesen display this only if it's actually applying a patch?
- Clicking on a menu bar item when a window isn't in focus doesn't produce a menu dropdown, but I'm able to interact with other elements in this way.
- Having been using the FCEUX hex editor for ~15 years, I'm not very fond of Mesen's yet because I can't get close to the same density without making the text unreadably small, but I don't yet have a concrete suggestion here (Font? Row spacing? Dunno) and I might get used to it, anyway. It just feels frustrating right now because I can view rows $0000-0670 in FCEUX and only $0000-0430 in Mesen without scrolling, and the addresses I care about for my game are generally in the $0000-051F range.
- Is it expected that the image in the event viewer lags behind the main window by 2 frames when advancing frame-by-frame? Does this mean the events also 2 frames behind?
- Would it be possible to have a mark in the event viewer for the first dot that should be impacted by a PPU write?
- I find myself wanting to look at unidentified blocks in the debugger, which requires going to Options > Disassembly Options > Show... > Unidentified Code/Data to see the blocks and then again to hide them. I would much prefer if either this got a hotkey or it were possible to double click on block headings in the debugger to expand/collapse those individual blocks.
- Do breakpoint address fields need to be populated with 0 by default? It took me a bit before I realized I didn't need to delete the 0 before typing the address I wanted to break on, since the leading 0 is dropped.
- Held inputs appear to be dropped across reset and power cycles. My game has a feature where holding a button combination on reset displays a debug screen so crash information can be manually displayed if the game hangs in a way it can't detect as a crash. I'm unable to reach this screen in Mesen, but this does work in FCEUX and on real hardware.
- There doesn't seem to be a shortcut key for "Save State - Slot 8".
Problems aside, this looks pretty promising and I look forward to getting more familiar with it.
Edit: Would probably also be helpful if event viewer marks showed the CPU address responsible for the event.
Edit2: I would really like an option for left/right in the hex editor to go by bytes instead of nybbles. Moving by nybbles seems unnecessarily granular to me and makes manually indexing into tables more painful.
Thanks for the feedback!
I've fixed/improved a number of things since the last build.
Here's a build with the latest changes:
downloadLet me know what you think. (And feel free to report more stuff if you find anything else)
Changelog: (sorry for the wall of text)
-Importing .dbg files now updates the CDL data, allowing the debugger to disassemble all the code ahead of time.
-Importing .dbg files for assembly projects that have file extensions other than .s should now work properly
-Improved the way the code window displays labels/comments inside data blocks
-Fixed an issue with hex numbers in the condition field (which was causing the crash)
-Breakpoints on registers should now be working again (was broken in one of my recent changes)
-Using the Pause button while the debugger is running should work better now (it won't bring the debugger to the front, and it will be able to resume if it was already paused)
-Clicking on menus/toolbars when the window is not in focus will now work properly without requiring an additional click (looks like this is a Win32 or WinForms issue)
-Added a "High Density Text" option in the hex editor (in the Text Size submenu) which reduces the blank space between lines - it should be relatively close to what FCEUX has. (also removed the Import/Export toolbar at the top since the same options are already in the File menu, and aren't useful enough to warrant the wasted space on the UI)
-Added a "Per-byte left/right navigation" option in the hex editor to force left/right keys to shift by a whole byte, rather than a single nibble.
-The 2-frame delay for the event viewer when stepping frame-by-frame was a bug - this is down to a 1-frame delay. The delay is due to the fact that the emulation is paused on scanline 240 (right after the picture is sent), while the event viewer refreshes later, on scanline -1, to allow the events that occur during VBlank to be shown. The picture & the events shown on it are always in sync.
-Added toggles for the verified/unidentified data blocks in the toolbar (and added shortcut keys: Alt-1 and Alt-2)
-Improved breakpoint window - invalid addresses now appear in red, 0 values now appear as blank when appropriate (and 0 otherwise)
-The event viewer's tooltips now display the value of the PC for the start of the current instruction.
This should fix most of the issues you've reported. The crash you were getting when clicking in the breakpoint list was fixed in the Feb 20th build. For the rest:
Fiskbit wrote:
- If the emulator is paused and the debugger is opened or closed, the emulator unpauses.
I'll try to see if this is something I can fix easily - but just so you know, the emulator's standard "Pause" feature is automatically deactivated when the debugger is opened. This is because it would interfere with breakpoints, etc (which is why there are differences in the pause behavior when the debugger is active)
Fiskbit wrote:
The emulator can pause when in the background, but this even happens when the emulator's own tool windows are in focus
It can be done, but it would need to be an additional option/flag, most likely. As it is, the option is meant to pause the game when you open option dialogs, etc. This is the behavior some people want/expect.
Fiskbit wrote:
When loading a game, the onscreen display tells me the emulator is applying a patch that doesn't (to my knowledge) exist
This is not supposed to happen - are you using a HD Pack? They can contain IPS patches which will automatically load when the HD Pack loads. Also, if the last time you ran the game you had an IPS patch loaded, close Mesen, and then launch the game via the game selection screen, it will automatically load that IPS patch again. The same is true for the "Recent Files" menu - it will display the IPS patch's name in brackets in the menu if an IPS file is linked to that recent file entry. If it's showing a specific filename when the game loads, that file should exist somewhere on your hard drive, and Mesen is patching the ROM with it.
Fiskbit wrote:
Would it be possible to have a mark in the event viewer for the first dot that should be impacted by a PPU write?
Technically, the change takes effect on the next cycle after the mark (as far as the emulation core goes). This is not true for all flags, as some (e.g grayscale, for example) have small delays (this hasn't exactly been documented/fully proven yet), but the knowledge on the specifics is too lacking at the moment to try and display any sort of indicator.
Fiskbit wrote:
Held inputs appear to be dropped across reset and power cycles
I can't reproduce this (at least, when I display the inputs for each frame with debug code, the buttons appear to be held down on every frame starting from the reset/power on). Was the debugger/etc opened while you were testing this? If you are able to send me the ROM, that would be helpful, too.
Fiskbit wrote:
There doesn't seem to be a shortcut key for "Save State - Slot 8".
This is normal - save slot 8 is the auto-save slot, it is not meant to be written to manually. This is a relic of before key bindings could be changed, though. I will probably eventually set the save slots limit to 10 and then have an additional one called "Load State - Auto-save Slot" or such.
Thanks for addressing all of my feedback, whether as text or new functionality. It's feeling a lot better already. I'm also really impressed by just how many options there are in this thing; I've been able to customize a lot of stuff to be roughly how I like it. The event viewer is fantastic; it already helped me discover a bug where an instruction I had placed into a BIT instruction's operand was causing BIT to read a PPU register. Very useful feature. At this point, I suspect the only major thing FCEUX has that this doesn't is LUA, which I use for object and background collision visualization, and I can totally understand not wanting to add that.
You can disregard my comments on the IPS patching and on held directions being lost on reset; turns out I had accidentally loaded a ROM with the same name that was one directory up, which was accompanied by an IPS patch and also didn't have the crash feature in it. That does bring me to another issue, though, which is that Recent Files doesn't show a full ROM path, which makes it difficult to manage ROMs across directories. Right now, I have two ROMs in the list with the same name and no clear way to differentiate them, which makes me have to clear the history and open the ROM through the open dialog.
The hex editor changes are really nice. The new "Use per-byte left/right navigation" open doesn't work correctly, though; after overwriting one nybble of the current byte, the selection moves to the next byte. A couple other thoughts on the hex editor:
- I noticed it doesn't seem to have a paste option, which is something I find really useful in FCEUX. There, paste overwrites bytes with the contents of the clipboard.
- Along those lines, an undo feature when editing PRG-ROM would be handy. I frequently make tweaks to the ROM in the hex editor and often back them out with undo after observing their behavior. Although maybe this wouldn't be compatible with the code editing features in Mesen's debugger? This seems less important than the paste feature, since that'd at least allow pasting the original bytes back in place.
The pausing is definitely improved at least a bit, and if you do anything more there, it'd be really appreciated. For context, in FCEUX, I make heavy use of pausing and frame advance while debugging so I can get to the exact frame something occurs on, or to set up specific circumstances with frame-perfect inputs. Your explanation for why the behavior is different when the debugger is active makes sense, but the differences do seem inconvenient at times. For example, the "Run Single Frame" shortcut brings the debugger to the front each time it's pressed, like a breakpoint has been hit. It's not clear to me if there's some other intended mechanism for frame-by-frame play when debugging that I haven't yet discovered.
Sour wrote:
Technically, the change takes effect on the next cycle after the mark (as far as the emulation core goes). This is not true for all flags, as some (e.g grayscale, for example) have small delays (this hasn't exactly been documented/fully proven yet), but the knowledge on the specifics is too lacking at the moment to try and display any sort of indicator.
That makes sense. Thanks.
Would it be possible to add the PPU's t register (temporary VRAM address) to the debugger window?
Sour wrote:
-The 2-frame delay for the event viewer when stepping frame-by-frame was a bug - this is down to a 1-frame delay. The delay is due to the fact that the emulation is paused on scanline 240 (right after the picture is sent), while the event viewer refreshes later, on scanline -1, to allow the events that occur during VBlank to be shown. The picture & the events shown on it are always in sync.
Doesn't refreshing at -1 instead of 240 mean that the events shown in the vblank region are a frame ahead of the rest of the screen? Experimentally, this seems to be the case, as I see polling for sprite 0 hits in vblank 1 frame before I see it in the HUD in Zelda. Having events split between two frames when using frame advance seems surprising to me.
Also, I've seen cases where the event viewer doesn't update when stepping frame-by-frame, but I don't know how to reliably reproduce it.
Thanks for the feedback!
Some more changes/fixes:
-Fixed the per-byte navigation option's behavior when editing values
-Added options to configure if the debugger comes to the front when a breakpoint/pause occurs (Options->Break On->Bring debugger to front [...])
-Added an option to display the full path of files in the recent files menu (Prefs->Advanced)
-Added paste support in the hex editor
-Added undo support for PRG ROM & CHR ROM edits. This undo is shared by all tools that can edit the PRG/CHR ROM (hex editor, assembler, chr editor), so pressing Undo will undo whatever the last change you did between those 3 tools. It's hardcoded to keep up to 100 undo steps (which means it'll take 100x the size of the ROM in memory - I could probably compress this to increase the number of undo levels if needed)
-Added the temporary vram address "t" to the console status display.
-Improved some pause-related issues with the debugger
Build with the changes:
downloadLet me know if there's anything else! Feature/workflow gaps vs FCEUX are one of the main things I am trying to fix, so all of this is definitely welcome!
Fiskbit wrote:
At this point, I suspect the only major thing FCEUX has that this doesn't is LUA
Ah.. but Mesen does support Lua scripting :)
API referenceScript WindowFiskbit wrote:
The pausing is definitely improved at least a bit, and if you do anything more there, it'd be really appreciated.
I've done some more improvements here - there are new options in the "Break on..." menu to configure whether the debugger should come to the front when a breakpoint is hit, or when a pause occurs. "Run Single Frame" in this case counts as a pause. Also, if the game is paused when you open the debugger, it will stay paused (regardless of whether or not the "break on debugger open" option is enabled), and will revert to its paused state when closing the debugger (although it will run 1 frame before pausing again.
Fiskbit wrote:
It's not clear to me if there's some other intended mechanism for frame-by-frame play when debugging that I haven't yet discovered.
You can also use the "Run One Frame" option in the debugger (F8), which will break the execution at the same cycle/scanline on the next frame. (vs the "run single frame" shortcut which will always break the execution on scanline 241, cycle 0)
Fiskbit wrote:
Doesn't refreshing at -1 instead of 240 mean that the events shown in the vblank region are a frame ahead of the rest of the screen?
I guess it depends how you're seeing things - the event viewer displays data top to bottom, in a chronological fashion - so the vblank section is the vblank where updates are being done in preparation for the next frame. Most other ways to display the events would have other issues (e.g events not being in chronological order, or vblank being at the top, which would mean the scanline numbers are out of order, etc.)
Fiskbit wrote:
Also, I've seen cases where the event viewer doesn't update when stepping frame-by-frame, but I don't know how to reliably reproduce it.
If you're holding down a key in the debugger (e.g F8), it's possible that the viewer doesn't update until you let go of the key, maybe that's what you were seeing?
EDIT: Found a small issue with the undo feature (could cause a crash due to multithreading) - I've reuploaded a new build to the same link that should fix the problem.
Thanks for the pausing improvements, in particular; that seems to be working pretty smoothly now. One last bit of weirdness I've found is that loading a saved state while paused will bring the debugger into focus, but that's pretty minor.
I totally overlooked the scripting feature, since I was glancing around for 'LUA'! Really great that that's in there; I'll work on converting my scripts over and will post if I encounter any issues with it.
Your reasoning for the event viewer behavior makes sense. The way I've always viewed things is that vblank is the start of the next frame rather than the end of the previous frame, so I'd probably prefer having scanline 240 at the top of the image, but this approach isn't perfect, either; I worked on a project many years back where rendering was disabled early on the bottom of the screen in order to have more vblank time, which would still look wrong with scanline 240 at the top.
Regarding the issue with the event viewer not always updating, I wasn't holding any keys (just pressing the Run Single Frame hotkey repeatedly), but I'm failing to reproduce it at the moment and it seemed pretty random when I was seeing it. If I see it again, I'll try to dig into it a bit more.
Some more issues I've encountered:
- Frame-by-frame with the debugger open prevents the vblank events from persisting in the event viewer.
- I can't completely figure out how the call stack is intended to work, and the documentation leads me to believe the behavior I'm seeing is buggy. In 2 games I've tried (Mega Man 1, Zelda 1), the call stack shows dozens of entries at any given time, with many of them being duplicates, even though the stack is small (e.g. SP == #$F9). In Zelda, for example, as soon as I first use frame advance, the call stack fills up with many "[nmi] $E484" entries.
- Entries on the call stack are removed when an RTS is encountered, not when it is executed. Hitting a breakpoint on an RTS seems like it make the call stack very misleading.
- Step Out in the debugger doesn't behave at all how I expect it to. As an example, in Zelda, if I set a breakpoint on $E53F (JSR $E62D), step into the function, and then step out, I would expect to be at $E542, but I'm instead at $E640. Using step out again takes me to $E544, one instruction further than I originally expected. What I think is happening: step out breaks after the first RTS that is executed, and it breaks one instruction too late (executes one instruction after the RTS). What I expect to happen: step out breaks when exiting the current function. So, when the current instruction is JSR, I would expect 'step into, step out' to be equivalent to 'step over'.
- If I break on a write to an address and then edit the register that's being stored into that address, the original value is still stored into memory.
- Writes in memory tools take effect nybble-by-nybble, so if I try to write a full byte while the game is running, it gets an intermediate value I never intended to write.
- Apparently saved states require the exact same ROM to be loaded, which is very inconvenient if I make a small change to my game and want to test it with those states. Can you add an option to load the state even if the ROM doesn't match?
- When a state fails to load because the ROM doesn't match, I get the following popup, which doesn't seem related to the action at all:
FDS bios not found. The bios is required to run FDS games.
Select bios file now?
- After interacting with the menu bar in any fashion, keyboard keys will open the drop down menu starting with that letter in addition to the expected functionality of controlling the game. This is mostly a problem after opening a ROM through Open or Recent Files; if I don't remember to click on the video region of the emulator, I'll accidentally open the debugger as soon as I start walking right.
- Sometimes when I'm dragging my cursor across menu bar items (File, Game, etc) while the drop downs are active, the drop downs suddenly become inactive. No idea how to reproduce this one; it currently seems random.
- Clicking on the video region of the emulator window when it's not the active window sometimes doesn't do anything, so it remains inactive and not in front. Clicking back and forth between the emulator and another window reproduces this quickly for me.
- Mousing over the Open dialog box causes it to jump to a new location if it's partially offscreen or even near enough the edge of the screen.
I saw that Mesen has CDL support, which I assume is the same CDL format used by FCEUX, since I didn't see any mention of it in the Mesen documentation. As a low-priority request, one feature I've been wanting to see for years is a more advanced code/data logger which could log information about how bytes are used rather than just whether they're code or data. The intent here would be to allow for better disassemblies with more automated labeling that can get closer to code that can be arbitrarily modified and reassembled without substantial manual labeling work. Examples of shortcomings right now include knowing whether data goes on to be used as a high or low pointer byte for an indirect table or jump (and what byte it's paired with), code and data that get relocated to RAM before being used, and tracking the bounds of tables. It's been a few years since I was doing CDL-assisted disassembly, but I also recall shortcomings with FCEUX's logs where mapper writes showed as data and code operands were logged just like opcodes (so operands that were also executed as opcodes weren't logged in any special way).
Edit: Is there a quick way to go to the current PC, or do I have to use Ctrl+G and type the address?
Fiskbit wrote:
Is there a quick way to go to the current PC, or do I have to use Ctrl+G and type the address?
you can double click on the top of the call stack
A very cool feature in the debugger is the Step Back and the code preview of a jump in the tooltip or the draw partial frame and others...
Fiskbit wrote:
- Frame-by-frame with the debugger open prevents the vblank events from persisting in the event viewer.
This is normal/a limitation - the frame-by-frame feature breaks on scanline 241, just before inputs are read - this allows the user to setup inputs for the next frame. But on scanline 241, vblank did not execute yet, so there is no way to display the vblank events. A workaround would be to setup a breakpoint on the last scanline+cycle of the frame and use that into of "run single frame".
Quote:
- If I break on a write to an address and then edit the register that's being stored into that address, the original value is still stored into memory.
This is hard to fix - the debugger has no knowledge of where the value being written comes from. By the time a write breakpoint occurs, the instruction is already halfway completed and the value that is about to be written to cannot be changed (although, with Lua scripting, it should be possible to change the write value)
Quote:
Writes in memory tools take effect nybble-by-nybble
I understand the problem, but the alternative is also problematic in terms of usability - there is no simple way to convey to a user that the first character they wrote actually has no impact until they write another character or move away (despite the hex editor showing the "new" value). I actually changed the code and tried it out, but I'm not convinced this is more intuitive (maybe as an option?).
Quote:
Edit: Is there a quick way to go to the current PC, or do I have to use Ctrl+G and type the address?
Like upsilandre said, the simplest way is to double-click at the top of the callstack. Other than that, there is also a "Show Next Statement" feature binded to Alt-* which has the same effect.
Other points:
-Event viewer not updating: This was probably due to the "Run Single Frame" feature stopping at random points in the picture when the debugger is opened (this is no longer the case since the previous build, always breaks on scanline 241)
-Save states requiring the same ROM: I'll see about this - will need to at least validate that the ROM is the same mapper, etc, otherwise allowing this could end up crashing the emulator, etc.
-The FDS prompt when trying to load a savestate for a rom that can't be found is fixed
-The callstack bug when breaking on RTS instructions should be fixed, and the step out feature should be working properly now.
-Menu bar staying active: I get the same problem and agree it's annoying - Can't think of a simple fix for it at the moment (e.g one that is low in terms of maintenance in the future), but I'll try to think of a general solution.
-Cursor across the menu suddenly not working: Haven't been able to reproduce this
-Clicking on the window not bringing it to the front: Same, can't repro, and I tried clicking pretty fast.
-Open file dialog jumping: This is standard Windows behavior - I'd imagine all programs using the standard windows dialogs do the same (FCEUX does at least)
-Callstack in Zelda/MM: As far as I know, some games do not behave "nicely" and may sometimes not call RTS/RTI a matching number of times for each JSR call and NMI. This "corrupts" the callstack (which is not based on the CPU's stack at all). Fixing this would be tricky/impossible, since code is not required to call RTS/RTI to work properly. A good portion of games should be working properly, though.
(Haven't really made any notable changes worth a new build just yet - I'll post one when I get some more things done)
Sour wrote:
lidnariq wrote:
Although maybe some kind of ruler during hblank might possibly be...
Not too sure I'm understanding what you mean - maybe adding an optional grid every X clocks would do it? Slightly unrelated, but I was also thinking of changing the background color for the scanlines where it is safe to run the sprite DMA (which is slightly different between PAL & NTSC, afaik)
(coming back to this really much later)
I think just showing bounds of when it's safe to do certain things? But on a scanline-to-scanline basis, most of these edges fall into two places- 1- the rightmost edge of active video, or 2- dot 320. And I'm not clear if having these edges displayed will be useful enough to balance out having to explain why there's a weird extra line, especially since the user
can use the breakpoint functionality to add it themselves.
Sour wrote:
-Callstack in Zelda/MM: As far as I know, some games do not behave "nicely" and may sometimes not call RTS/RTI a matching number of times for each JSR call and NMI. This "corrupts" the callstack (which is not based on the CPU's stack at all). Fixing this would be tricky/impossible, since code is not required to call RTS/RTI to work properly. A good portion of games should be working properly, though.
How would your separately tracked call stack treat the
message dispatch idiom used in several of my own games?
Code:
move_actor:
ldy actor_class,x
lda move_procs+1,y
pha
lda move_procs+0,y
pha
rts
Or use of the stack as a threaded code mechanism in
ROPslide?
Consider the following algorithm. Would it work in more cases?
1. On each addition to the call stack, save S.
2. After any RTS or RTI, discard call stack elements whose S is less than the current S.
lidnariq wrote:
I think just showing bounds of when it's safe to do certain things? But on a scanline-to-scanline basis, most of these edges fall into two places- 1- the rightmost edge of active video, or 2- dot 320.
I could always add a checkbox to enable/disable a vertical region on the right that shows the cycles where it's safe to change the registers, etc.
tepples wrote:
How would your separately tracked call stack treat the message dispatch idiom used in several of my own games?
This ends up calling RTS more times than JSR, so it would have the opposite effect of what MM1 does (e.g the callstack would empty itself and become out of sync). Your idea would prevent the stack from growing infinitely like it does in some cases, though. On top of that, I would need to try and detect when RTS is used as a way to perform a jump to another subroutine (e.g after pushing the address on the stack), and replace the top of the callstack with the new location after the RTS is executed. Overall it can probably be improved by a few things like this, though I don't think it'll ever be "perfect". I'll try to tinker some more with it when I get a chance.
FCEUX's hex editor only commits when the full byte is written, but the difference there is that it's not possible to ever select just the low nybble, so that does make the interface problem harder. I'd be happy for an option to sacrifice low-nybble selection if it made the write committing make more sense; I usually want to select the high nybble, anyway, and get the low nybble by accident because I'm not used to it and it has a larger size (since it includes the space between bytes).
Regarding the call stack, the issue in Zelda is that it uses JSR to pass the address of jump tables to an indirect jump function (JSR to function, PLA PLA to get the table address, JMP ($xx) to use the entry from the table). This is done all over the code. Coming from FCEUX, I'm used to just looking at the stack for return addresses rather than having a call stack feature, but with how small Mesen's stack view is (only 3-4 bytes visible at a time vs 20+ in FCEUX), it doesn't seem that practical to use in this manner. Given that, any improvements you may make to the call stack would be very welcome.
I think I'm finally about out of feedback, at least for now. Thanks for all the work you've put into this!
Nice debugger... a shame I can't get OSX to run mono!
One thing I couldn't find and that saved me the day during Gameboy development on BGB was the ability to break on reading unitinitialised variables...
Seeing the exact list of uninitialised variables greyed-out over the whole RAM memory map could come in handy to see how much memory is left. Also, one could cherry-pick variables to watch for cheats whilst one is playing, which would probably make TASers very happy!
Finally, in the long term it would be cool to merge such an emulator with an actual assembler, barring the need to manually compile code each time and allowing one to immediatly spot the differences a change in the source has on the actual game... but maybe this just-in-time assembly is still a bit to much too futuristic.
I've done some improvements to the callstack, it seems to be able to handle Zelda & MM1 properly now. Essentially, when it hits a RTS/RTI instruction, if the previous callstack info doesn't match the CPU's stack, it will try to find a matching callstack line & remove all the lines above it. If it can't find a matching line, it will add a new line to the callstack instead (and assume the code pushed an address to the stack and then called RTS to jump to it). Hopefully this takes care of most games - let me know if you still find issues with it.
I also changed the stack display to show more bytes (should show up to about 10 bytes now, instead of ~4) and fixed a bug that was causing it to display an extra byte in the list that wasn't supposed to be shown.
The build also has some fixes I mentioned earlier (e.g step out), some more improvements based on rainwarrior's feedback in the Mesen thread (customizable font, a few new buttons/options, a new pause icon for when the debugger is opened), and should also improveme emulation performance when debugging tools are opened by about 60-70% (on the windows build).
Build:
downloadYvar de Goffau wrote:
a shame I can't get OSX to run mono!
I wish it was easier for me to try and make Mesen work on OSX - it's fairly likely it could be made to work without that much effort, unfortunately I don't own a Mac, and it sounds like trying to make OSX work in a VM would be a bit of a pain (plus I think you technically need to buy a Mac to have a license to use OSX?).
There is a way to highlight uninitialized variables at the moment (but it requires that the debugger be attached from the ROM's power on), but no way to break on them. Uninitialized memory is definitely one of the most common issues with homebrew though, so it might be worth trying to improve this a bit.
Cherry-picking variables to watch them can technically be done with the watch window, although it might be a little less "advanced" in some aspects to FCEUX's memory viewer (if that's what it was called).
It's already technically possible to edit code in PRG ROM with the built-in assembler, but I understand what you mean. What you're asking for would be essentially the same "Edit-and-Continue" in Visual Studio... and that feature doesn't work properly half the time in my experience, so I'm pretty confident it would be pretty hard/impossible to get it to work properly in this case :p
Sour wrote:
it sounds like trying to make OSX work in a VM would be a bit of a pain
When I tried it a year or so ago (some coworkers were using a few Mac-only programs and I don't own a Mac) it was fairly easy, pretty much the same as setting up a Windows VM. I don't remember if the image I used was modified in any way, though. Either way this is probably illegal, I don't think you're allowed to run Mac OS on anything but a Mac.
It's a violation of Apple's license to use their OS X software to run it on anything but their official products. Doing so is not necessarily illegal, though. Overriding antitrust/etc. laws might be in effect depending on where you live. (Practically speaking, though, it won't really matter either way, because this part of the EULA isn't actually enforced in any meaningful way.)
I've run a few versions of OS X in VirtualBox, and they work well enough. Even was compiling code with XCode on one of them. Haven't tried more recent versions of the OS but there weren't really any notable problems except the usual low performance of a VM.
To get OSX into a VM you usually need to modify and tweak the OSX installation. It helps if you have Hackentosh compatible hardware, as Macs have very limited driver support. So it can be as easy as using a Hackentosh modded OSX image, or it can be pain. YMWV
Yeah, I used a Hackintosh image and VirtualBox, it worked fine.
In the latest version, I'm getting the following exception when opening the debugger with ctrl+D after starting a ROM:
System.ArgumentOutOfRangeException: Length cannot be less than zero.
Parameter name: length
at System.String.Substring(Int32 startIndex, Int32 length)
at Mesen.GUI.Debugger.ctrlConsoleStatus.UpdateStack(UInt16 stackPointer)
at Mesen.GUI.Debugger.ctrlConsoleStatus.UpdateStatus(DebugState& state)
at Mesen.GUI.Debugger.frmDebugger.UpdateDebugger(Boolean updateActiveAddress, Boolean bringToFront)
at Mesen.GUI.Debugger.frmDebugger.<>c__DisplayClass22_0.<_notifListener_OnNotification>b__1()
at System.Windows.Forms.Control.InvokeMarshaledCallbackHelper(Object obj)
at System.Threading.ExecutionContext.RunInternal(ExecutionContext executionContext, ContextCallback callback, Object state, Boolean preserveSyncCtx)
at System.Threading.ExecutionContext.Run(ExecutionContext executionContext, ContextCallback callback, Object state, Boolean preserveSyncCtx)
at System.Threading.ExecutionContext.Run(ExecutionContext executionContext, ContextCallback callback, Object state)
at System.Windows.Forms.Control.InvokeMarshaledCallback(ThreadMethodEntry tme)
at System.Windows.Forms.Control.InvokeMarshaledCallbacks()
Aside from that, after using this more extensively over the last week, I've got a little bit more feedback:
- One can copy code from the debugger to paste into a text editor, but there seems to be no way to include any addresses, which is a big problem for branches/jumps/calls. I've been having to fall back on FCEUX when doing this.
- When setting a breakpoint, it would be much more convenient if the textbox for 'Specific' address were selected by default so one could just type an address and hit enter, rather than having to first click in the box.
- Using ctrl or shift with the mouse to select multiple addresses in the breakpoints section doesn't behave properly; rather than highlighting multiple entries, it toggles the current breakpoint. Shift with the arrow keys works correctly, however.
- The "Bring debugger to front on break" option unexpectedly applies to loading saved states.
RE: OSX, I guess I'll have to take a proper look eventually. I am running a Ryzen CPU at the moment, but it looks like some other people have had success running OSX in a VM with one. For the moment I'd rather focus on adding missing features/fixing bugs rather than add support for another platform, though (since every additional platform adds an overhead in terms of testing & releasing new versions, etc.)
Fiskbit wrote:
I've got a little bit more feedback:
Thanks for the feedback!
A few fixes/changes:
-The crash you saw should be fixed - it occurred when the stack pointer was set to $FF
-I added options to configure the copy's behavior (whether or not to copy addresses and/or byte code)
-Breakpoint window now focuses on the address field when it's opened
-Ctrl/Shift clicking on the breakpoint list should be working normally now
I can't seem to reproduce the save state issue you are getting, though.
I've tried loading savestates in a few games and the debugger never comes to the front. Can you try saving a state and loading it right away to see if it causes the behavior, too? What "Break on..." options are enabled? Does the debugger actually break, or does it just come to front and the emulation keeps on running?
Build:
download
The saved state behavior seems to only happen when the emulator is paused. I have the emulator paused (with Escape) and press an F key to load a state, and the debugger comes to the front if the the "Bring debugger to front on break" option is selected. Apologies for the incomplete report before; I'm frequently paused when using saved states for development and didn't realize the behavior differed when not paused.
The crash issue is fixed, the copy feature seems to work great, and I'll give the rest of it a try another night. Thanks for the update!
Edit:
I've encountered a few problems with the March 6 version:
- The callstack seems much improved, but it doesn't correctly handle Step Back in Zelda.
- Step Back seems to not be working properly and I'm not sure exactly what's going on. In Zelda, if I set a write breakpoint on $EC (next_screen) and walk off the edge of a screen, the breakpoint correctly triggers at Bank5_B53A. In order to change the value being written, I use Step Back and Step Into to get to the start of the instruction and then set A to my desired value. In this version, instead of taking me to Bank5_B538, Step Back (almost always) takes me to Bank5_83E6. The PPU state is 3 cycles earlier on the same scanline, but the code it's at is actually later in the same frame. This reproduces fairly consistently for me, but I had one instance where it worked properly and I'm not sure what I did differently that time.
- When opening the debugger, the checkboxes for inactive breakpoints aren't drawn.
So, I got around to trying out my hacked version of Years Behind debugwrite-hack (i.e. replacing the scroll register writes with setting/clearing the monochrome bit) on my PAL NES.
Like I remembered, the timing is about as vertical as can be - perhaps being just *slightly* off for one or two playback rates. Here's a video capture of the DMC-enabled tunes:
https://drive.google.com/open?id=1JVvSYFIShNs_zHKjv7CJBRKsBdD9SCcrThe purple vertical bars bounces around in a chaotic way and gets a bit wobbly, so it's not obvious at first. But doing a closer comparison in an emulator clearly shows way less skew than what Mesen - and FCEUX/Nintendulator - end up with.
So yeah, it does look like our understanding of the PAL version of the DMC DMA is incomplete, and no emulator seems to emulate PAL DMC DMA timings correctly. Given that the PAL DMC fixed the hardware bug causing incorrect controller reads, it's not unlikely that the rule for how many cycles to pause could be very different from the NTSC version.
Not sure what would be the best way to get the true values. But re-visiting the DMA tests that Blargg/cpow/Disch have done is probably a good starting point...
Some more fixes/additions:
-Debugger shortcuts can now be customized in Options->Configure Shortcut Keys (but they are limited to keyboard shortcuts, gamepads will not work). This includes a "Toggle Break/Continue" shortcut to mimic the "Pause/Play" behavior on the main window - both are mapped to Esc by default. If there's any toggle/action that doesn't have a shortcut binding let me know and I can add one. Hopefully this takes care of a number of usability issues with the debugger.
-Added a "byte editing mode" to the hex editor that will only "commit" a change once both nibbles are written (enabling this disables the ability to select the lower nibble by clicking)
-Fixed a bug with the step back code - when stepping back, the emulator rewinds X number of frames and plays them back, pausing when it reaches the previous statement. There was a bug that caused all buttons to be considered as unpressed when replaying the very last frame before pausing, which could cause the execution to diverge and end up breaking on the wrong line.
-Loading a state while the debugger is paused will no longer bring the debugger to the front when "bring to front on break" is enabled
About step back vs the call stack, currently the rewinder has no knowledge of the call stack - so while it rewinds, it affects the callstack like if it was executing normally. I can probably fix it, but it'll take some effort, I'll keep it in my notes.
For the inactive breakpoints not showing up properly, could you post a screenshot of what you mean? I haven't been able to reproduce this on my end (and can't really think of a reason why it might happen in general)
Build:
downloadBananmos wrote:
[...]
The PAL NES in general hasn't really been tested all that much, compared to the NTSC version. I'd help if I could, but I'm no 6502 expert, don't have a custom board/powerpak/everdrive, and don't have a PAL NES, either :p
It would definitely be interesting to figure out what's causing the discrepancy between emulators & the actual PAL NES, though.
Possible bug report:
A VRC6 (mapper 24) ROM I made a while back:
http://rainwarrior.ca/music/sundried.nesThe PPU viewer says "horizontal" mirroring but is incorrectly showing the result of vertical mirroring. (This was the first ROM I ever made, but it doesn't fail on any other emulator I know of.)
Edit: apparently the fault was my ROM, but it was not exposed by several emulators I had tried it with due to obscurity of implementation. See below.
ROM has been updated, used to initialize $B003 with $04, now uses $24.BTW being able to select font for the disassembly is fantastic. I can easily see twice as many lines in there now.
That's partially an error in early VRC6 documentation. You have to write $24, not $04, to register $B003.
(The layout in the PPU viewer and the memory map in the debugger agree on vertical mirroring; I don't know why the "Mirroring Type" text disagrees)
lidnariq wrote:
That's partially an error in early VRC6 documentation. You have to write $24, not $04, to register $B003.
(The layout in the PPU viewer and the memory map in the debugger agree on vertical mirroring; I don't know why the "Mirroring Type" text disagrees)
I'm a little confused, then. Are Nintendulator, Nestopia, FCEUX and the PowerPak getting this behaviour wrong?
Edit: the answer is yes. Correct emulation of this is not necessary for any of the Konami games, apparently, which never fail to set bit 5 of $B003.For the nametables, if the $20s bit of $B003 is set and the lower 4 bits of $B003 have one of the following values, CHR A10 is replaced
This mentions replacing CHR A10 but says nothing about CIRAM A10. It also says "not replaced" for some values, which I'm confused how it's different from "vertical mirroring"... I guess if bit 4 of $B003 is set, normally CHR10-17 are replaced by the designated banking register, right? So this is an additional CHR override in that case? What gets overridden when bit 4 is not set? Is the incoming signal in that case PPU A10? Does the override also apply to CIRAM A10 instead of CHR A10?
As far as I know, only Bizhawk, Mesen & puNES pass the VRC6 mirroring test rom that natt made (it's on the wiki).
I don't pretend I even slightly remember what the behavior is (took me ages to wrap my head around it the first time around) - but the current behavior "should" match an actual VRC6 chip.
The label at the bottom of the nametable viewer might be wrong in this case - it only works for games that use the "simpler" mirroring management code (e.g the majority of mappers), but it won't work for mappers that require more customization. (A bit like the MMC5 doesn't display proper banking data at the bottom of the debugger window, either)
rainwarrior wrote:
I'm a little confused, then. Are Nintendulator, Nestopia, FCEUX and the PowerPak getting this behaviour wrong?
Yes.
Quote:
This mentions replacing CHR A10 but says nothing about CIRAM A10. It also says "not replaced" for some values, which I'm confused how it's different from "vertical mirroring"... I guess if bit 4 of $B003 is set, normally CHR10-17 are replaced by the designated banking register, right? So this is an additional CHR override in that case? What gets overridden when bit 4 is not set? Is the incoming signal in that case PPU A10? Does the override also apply to CIRAM A10 instead of CHR A10?
CIRAM A10 is always connected to CHR A10. I should add that explicitly to the page.
It's confusing, and I'm too familiar with the subject material to figure out how to make it clearer.
Thanks. I'll fix my ROM, and I'll make an attempt to improve the Wiki now that I understand.
Edit: Ha ha ha, I feel a lot less bad about my bug after looking at
the version of the wiki page from when I wrote the ROM.

Had no idea that whole $B003 register was mostly unknown until 2014!
Goto in memory viewer has a 4 digit limit. This limit makes it ineffective on PRG-ROM.
Event viewer has a "marked breakpoints" option but the marked breakpoints don't seem to appear unless they are also enabled to break, but if I do that I can only see one at a time (since the event viewer only shows events since last break?)
PPU CHR viewer has option to display on a particular scanline, but if you pause emulation to look at the same scanline I have to go into the debugger and manually advance to that scanline. It's nice to have the ability to see immediate PPU updates like this, of course, but it makes it really hard to e.g. advance frame by frame until the thing you're looking for comes up and inspect what that frame was up to at scanline 100.
Though on that though a "break on scanline" feature might be interesting to have? Would kind of be a substitute for frame advance + see PPU on particular scanline.
Some changes:
-Memory viewer's goto's character limit is now based on the size of the memory type being displayed
-Added a "Refresh on pause/break" option to the ppu viewer & event viewer
-Added a "Break on..." option (that currently only allows you to break on cycle 0 of any scanline, but might add some more stuff in here later on)
-The UNROM-512 mirroring issue you mentioned in the other thread should be fixed (hopefully)
Build:
downloadAbout the event viewer, though, I can't reproduce the behavior you're getting. Marked breakpoints appear even if "Break Execution" is not checked, and all events appear, not just the ones since the last code break. Are you getting this for any game, no matter how you open the event viewer, whether or not the debugger window is opened, etc?
At this precise moment, the build is broken for me:
Code:
Debugger/frmDbgShortcutGetKey.cs(22,33): error CS1043: Invalid accessor body `=>', expecting `;' or `{'
Debugger/frmDbgShortcutGetKey.cs(22,55): error CS1043: Invalid accessor body `=>', expecting `;' or `{'
Task "Csc" execution -- FAILED
Done building target "CoreCompile" in project "$HOME/src/Mesen/GUI.NET/GUI.NET.csproj".-- FAILED
Done building project "$HOME/src/Mesen/GUI.NET/GUI.NET.csproj".-- FAILED
Build FAILED.
Errors:
$HOME/src/Mesen/GUI.NET/GUI.NET.csproj (default targets) ->
/usr/lib/mono/xbuild/14.0/bin/Microsoft.CSharp.targets (CoreCompile target) ->
Debugger/frmDbgShortcutGetKey.cs(22,33): error CS1043: Invalid accessor body `=>', expecting `;' or `{'
Debugger/frmDbgShortcutGetKey.cs(22,55): error CS1043: Invalid accessor body `=>', expecting `;' or `{'
0 Warning(s)
2 Error(s)
Time Elapsed 00:00:01.2859550
make: *** [makefile:75: ui] Error 1
this is after having "make clean"
Should be fixed - my fault for trying to save a few keystrokes by using recent C# features :p
The new build fixes the erroneous writes to the last CHR page.
Now that this is working, though, it has exposed another problem, but only in one of the 2 ROMs. Both ROMs have the battery flag set, and the log window output for both of them is the same.
However, one of them ends up treating a write to $8000 (the blinking lights) as a write to the banking register and corrupting ROMs. (Otherwise doesn't usually crash, because the code until the next real bank register write is all in the fixed bank.) I'm not sure how this is possible given the source code for that mapper, though, yet I can clearly watch it happen in the debugger and visually as the wrong CHR table is displayed. Unless HasBattery can be cleared aftrer the log in some way? (Yet it's working for the other one...?)
Attachment:
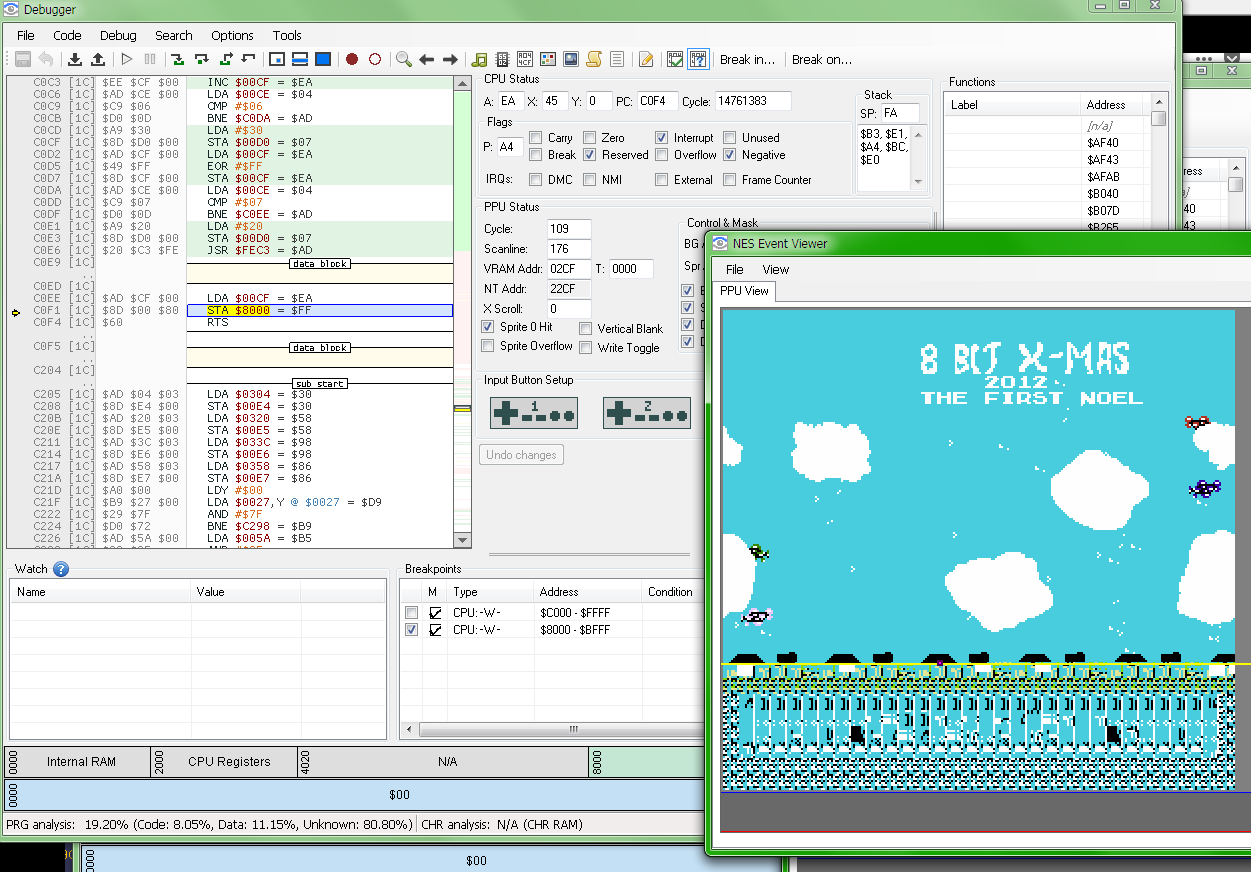 xmas2012_bad_bank.png [ 93.34 KiB | Viewed 3729 times ]
And to demonstrate what I mean about the event viewer, here I have marked breakpoints in magenta and you can clearly see where I have breaked (compare to image above for the two set breakpoints, all i've done below is clicked the one checkbox indicated):
Attachment:
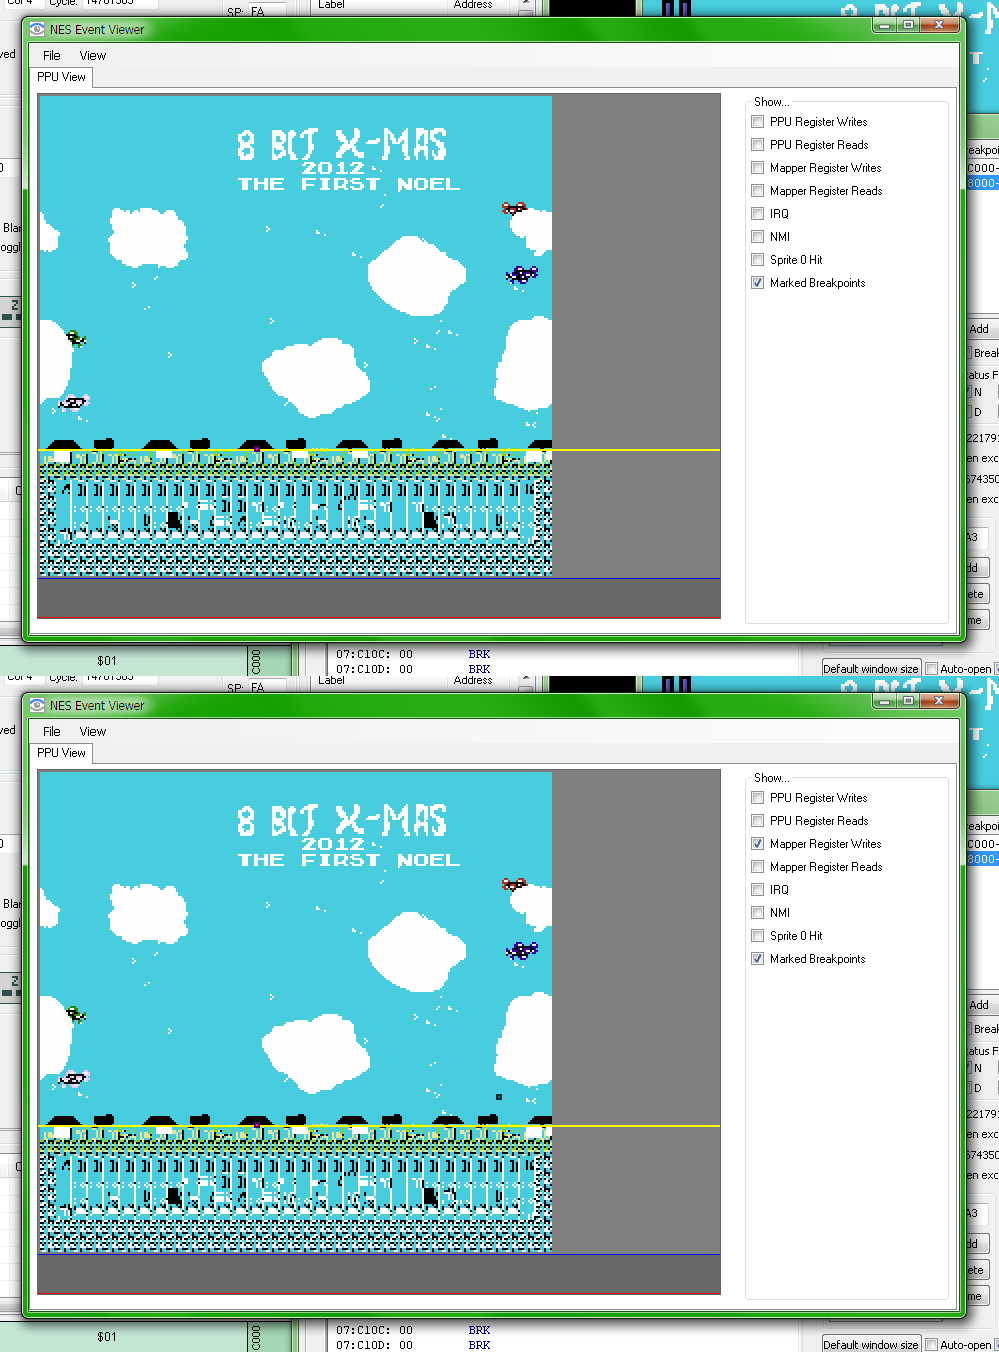 xmas2012_missing_events.png [ 108.24 KiB | Viewed 3729 times ]
I can turn on mapper register writes and see the other write (to $C000-FFFF, which has a breakpoint set to show in the viewer, but is not breaking). When I hit the breakpoint here for $8000, I can see the event for the breakpoint I have just hit, but the others never show. If I turn the breakpoints on but leave them set to show, they never appear at all. They only appear when I actually break execution on them, and even when I do that I will only ever see the one I just broke on.
Thanks for the screenshots - the breakpoint events were getting overridden by the "mapper register write" (because they both happened at the same scanline+cycle) - fixed it so the UI keeps track of all events that occur on a given scanline+cycle, so the breakpoint events should display properly now.
And based on the log you posted in the other thread, the most likely problem is that HasBattery() ends up being false (for both games?) because the save ram's size is set to 0 bytes in the NES 2.0 header. This was to avoid loading/writing .sav files when there is no actual save data - I've changed this so that HasBattery() is still true, but the .sav files won't be created if the size is set to 0 bytes. Hopefully both roms work properly with this.
Build:
download
Yep, both ROMs work correctly with this one. Thanks!
2012 is now fine. 2014 had been working with the previous version too, but it's possible that it had the same problem in an innocuous way that I wasn't noticing.
The breakpoint events now work as expected too.
Following a discussion I had with Bananmos and after what felt like an eternity's worth of coding and refactoring, I've finally added source-level debugging support for CC65/CA65 projects.
This adds a "Source View" that allows you to debug using the original source code (and step through it) and also offers a number of advantages over the regular disassembly view (e.g local variables, being able to see code that is not currently mapped to CPU memory, etc.). It works for assembly & C projects, but the C support still needs a bit more polish.
Example:
Attachment:
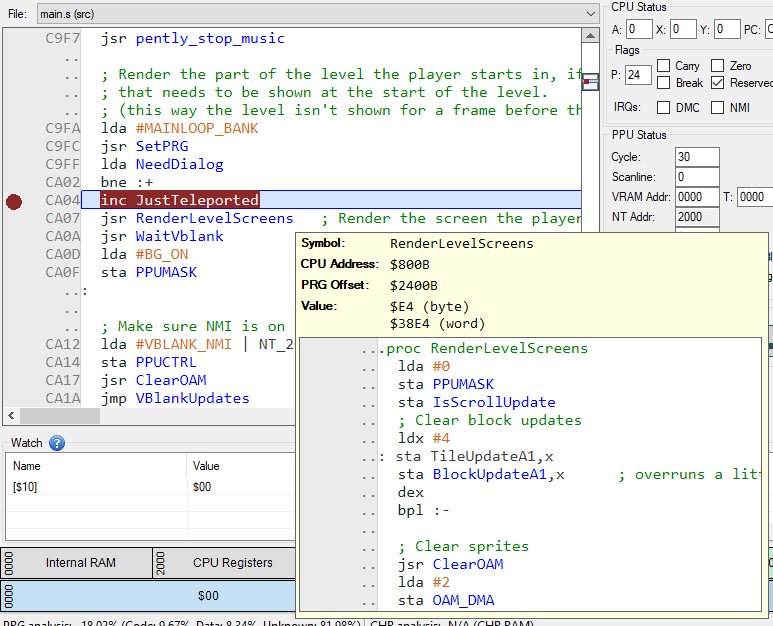 sourceleveldebugging.png [ 62.45 KiB | Viewed 3623 times ]
In the screenshot, you can see that the preview tooltip is able to display code that is not currently available to the CPU (the code for "RenderLevelScreens").
And here's what it looks like with a project coded in C:
Attachment:
 cproject.png [ 21.02 KiB | Viewed 3619 times ]
There's also a new option to display the original source files as comments in the disassembly view:
Attachment:
 showascomments.png [ 30.07 KiB | Viewed 3623 times ]
Feedback/bug reports on this feature would be very welcome, if you have CA65/CC65 projects to test it on (I only have a handful of projects that I currently test with).
Build:
downloadTo turn the feature on, you need to generate the .dbg when compiling and load then load it in Mesen's debugger (or turn on the auto-load .dbg file option). Once a .dbg file is loaded, you can right-click on the code window and select "Switch to Source View" (Ctrl+Q by default) to turn on source level debugging.
Also, when in "Source View" mode, all labels/comments defined in the debugger are ignored. The source view's labels, etc. are taken straight from the .dbg file and cannot be altered (this was needed for a number of reasons).
Very cool! I don't think I can use this feature, though... My linking configuration generates multiple output files, that I combine externally after assembling, so I imagine it will be impossible for the emulator to know where each line of code ended up in the final ROM.
I tried it anyway, and while I can see all my source files, the emulator isn't able to follow the program's execution (i.e. it doesn't highlight the current instruction, breakpoints don't work, etc.), and the "show source as comments" option doesn't do anything either, which's expected.
The reason I build my ROMs like this is because I want to dynamically align code/data of different sizes to the end of each PRG-ROM bank, so I need to assemble the end of the bank before the beginning in order to get its size and pad the beginning appropriately, which means I have to combine all the parts in the correct order after assembling everything.
Maybe some intermediate file could be used to assign a set of .dbg files each to a specific region of the ROM?
Well, in my case I still have a single .dbg file, since I still assemble everything at once, it's just that my linking configuration file specifies different output files for different memory sections.
Oh, well in that case I suppose what is needed is a list of MEMORY block to ROM location overrides?
In some of my projects I've split things into separate link steps, which is what I'd assumed you were doing. That would require a multiple .dbg mapping.
To handle both styles, it could be a list of entries with 3 pieces of information?
- 1. .dgb file
- 2. MEMORY block
- 3. ROM location override (presumably just the start address?)
I dunno if we're getting into territory where there might be a zillion ways to organize things though.
I suppose as an alternative workaround, though you could process the .dbg file to inject the final ROM addresses back into it. (Or in my case, I could synthesize a .dbg file of my own from the separate ones.) From FCEUX I was already used to having my own script to build the .NL debug files anyway.
rainwarrior wrote:
I suppose as an alternative workaround, though you could process the .dbg file to inject the final ROM addresses back into it. (Or in my case, I could synthesize a .dbg file of my own from the separate ones.) From FCEUX I was already used to having my own script to build the .NL debug files anyway.
I made scripts like this before, but the common kind of symbolic debugging in FCEUX and Mesen never worked well for me, since I reuse RAM a lot in different parts of my programs, from function parameters and local variables to modules that don't run concurrently, so there was no way I could give a single name to each memory position and have the symbolic disassembly make sense.
What I'm doing now is generating my own symbol file using macros (for labels/variables that are created through macros), so I get to choose which symbols end up in the file and which don't. Everything that uses shared memory normally doesn't go to my custom symbol file, but when I'm debugging a specific module or function, I enable the output of their respective symbols, and there are no conflicts.
Source-level debugging should pretty much solve that problem though, so I'll see if patching the .dbg file isn't too much trouble.
It's possible that your .dbg file contains the information required to make it work properly already.
The .dbg files does list the file offsets based on the output filename (so I assume it's meant to support multiple files), but all the projects I have at the moment only have a single output. If you can PM me the .dbg file you get, I might be able to figure out a way to make it work?
Another feature request that probably already exists (as most of mine do!):
I love that there's a way to ask it to randomize ram at startup. Is there a way to make it start in a random bank/banks? (which I realize is slightly complicated because it has to work for each banking scheme). It would be nice to be able to properly test to make sure my stubs to jump into the first bank are all working right.
Thanks!
This isn't a feature at the moment, but something I have been considering for a while. The problem is that I see no simple way to making it work for all ~250 boards Mesen supports without having to check all of them, validate what their know bootup state is and then alter their code as needed.
At the moment, on mappers with banks smaller than 32kb, Mesen does try to leave the banks as open bus (except the fixed banks), which forces you to initialize the mapper properly (and prevents it from working when it shouldn't) - but sometimes implementation details make it so it's easier to just select bank 0 everywhere (e.g MMC3 does this, among others)
Either way, it should be relatively easy to implement randomized banking for common commercial/homebrew mappers, though, since that would restrict the list to about 10-15 mappers or so? I'm not sure which mappers would be the most important to target (beyond the obvious ones like MMC/VRC mappers, etc.) - so if anyone has a list/suggestions to make, that would be helpful (esp. when it comes to popular homebrew mappers).
I'd think open-bus would be the useful default, instead of random banks ...
Maybe only the common ones that use 32K banking would be random banks?
lidnariq wrote:
Maybe only the common ones that use 32K banking would be random banks?
BNROM and GTROM were the two that I had in mind, both with 32k banks. (Both of which I recently ran into bugs when testing in hardware because of errors in my startup bank switching that I never saw on emulators)
Please disregard my reply if the requested feature is already available.
What I want is integration into Visual Studio 2017 (or JetBrain's IDE product) as an extension so that we can simply load a ROM (.nes file) by clicking a menu item or toolbar button and start debugging, just as we normally do with C/C++ code inside VS. Because Visual Studio or JetBrain's IDE product has already provided a rich set of debugging tools like setting (conditional) breakpoints, stepping over and into, watch (and change) variables, viewing memory and CPU contents, etc., it makes more sense to take advantage of this existing IDE instead of creating a separate new one having the same function (or quite possibly less functions with more bugs), and of the expertise most of us already have working inside of it.
While connecting an existing IDE with Mesen's debugger via a protocol like gdb might be feasible (like it was discussed earlier in the thread), implementing the entire emulator as a Visual Studio (or other IDE) plugin that would allow you to load NES files right into the IDE would be a gigantic task (and essentially akin to rewriting the entire project).
The end result would be that people now need to download and install a specific IDE (e.g VS, which is several GBs in size) to use the debugger. And while VS is widely used, not everybody uses it, and people may not be able to use it at all (e.g Linux users) - the same could be said of any other specific IDE. So while I can see some of the appeal of being able to use an existing IDE for this, I don't think I agree that it would be a better solution, overall.
Either way, though, this is definitely not something that I will be doing - it would probably take several hundred hours of my time to complete this kind of project (if not more).
Hi.
Im new to nesdev so apologies if I havent read the whole thread. Here are a few ideas I came up with from using Mesen for about a month (its awesome btw).
- It would be nice if CTRL+R worked when the focus in on the debugger. I often set the game in a specific state to debug something and resetting quickly is nice.
- A little debugger watch syntax that could be added to visualize arrays starting at a specific address would be useful. Not having to bring up the memory viewer for some small stuff is nice. Visual Studio has a couple versions of this. If I write "ptr,10" it will show me the 10 first element of the array starting at ptr. Of course VS knows the type, Mesen doesnt. Having a way to see arrays of byte or word would be great. Another syntax VS has is "ptr,mb" (in this case mb means memory byte). It will show me the first few bytes starting at this address. (https://docs.microsoft.com/en-us/visualstudio/debugger/format-specifiers-in-cpp)
- Being able to view the tiles and attributes that were recently updated in the PPU debugger would be cool. I had to implement 4-way scrolling, which was super annoying, so I ended up writing myself a little C# app on the side to see what was going on. Here is a screenshot if you need inspiration, red shows tiles updated recently, yellow are attributes.
That's all I got for now.
Keep up the good work.
-Mat
Wanting to investigate nametables or CHR across scanline splits, I tried opening multiple PPU debug windows and give them each a different scanline display option. Unfortunately, this option does not seem to be per-window, but rather a global thing where only the last value takes effect. (Also displaying the wrong value for one of the windows, since changing one does not update the other... but ideally it wouldn't be global anyway.)
Probably not a trivial thing to implement, but since this emulator has the (unique?) feature of duplicate PPU debug windows, seems a shame it's not available.
I gave the tile/attribute highlighting a shot with the data I had available in the UI already:
Attachment:
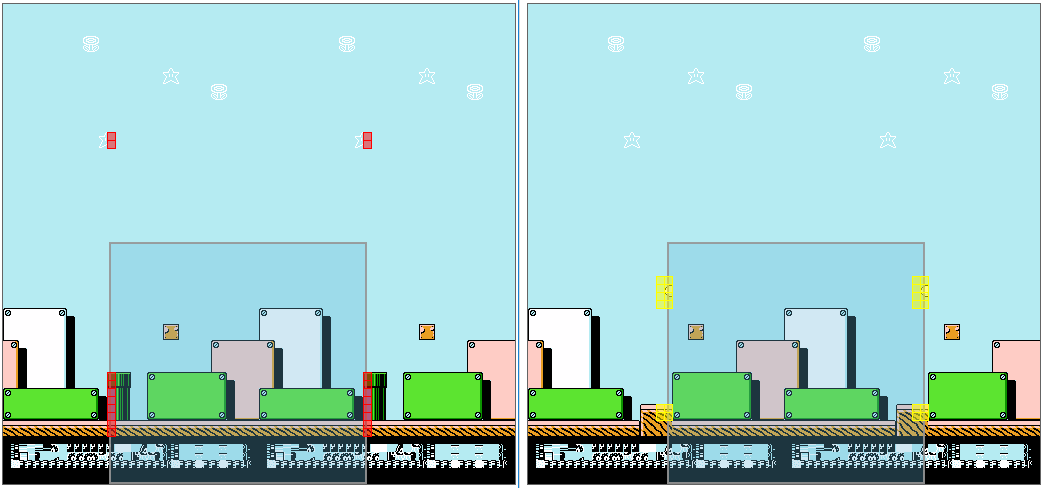 highlight.png [ 23.25 KiB | Viewed 4887 times ]
As is, it only highlights PPU writes that actually change the data (so if the game writes the same value twice, it won't highlight). The highlights only stay on the screen for a single frame, so usually have to play the game in slow motion to see them for a decent amount of time. I could fade them out over time (with a lot more logic), but then that would make it harder to discern on which specific frame an update occurs. Is this sufficiently useful as is? If so, I just need to add a checkbox to toggle the highlight on/off and I'm done :p
-Reset: I'll add customizable reset/power cycle shortcuts to the debugger window
-Array/etc syntax in the watch: I can see the use here, but making it work with the rest of the code that's currently used for watch expressions involves a lot of changes - can't promise anything on this one, but I'll add it to my list of future improvement ideas.
rainwarrior wrote:
Probably not a trivial thing to implement, but since this emulator has the (unique?) feature of duplicate PPU debug windows, seems a shame it's not available.
The multiple PPU windows were originally just a way to allow someone to look at multiple tabs at once (instead of splitting the tools across multiple separate windows), but I never really considered the interaction with the scanline/cycle fields. Making the scanline/cycle fields a per-window option wouldn't be hard, I'm mostly worried about the performance impact of having to check through an "array" of scanline/cycle combinations on every PPU cycle vs comparing with a single fixed value. It might not have that much of an impact though, I'll check.
Wow thanks!
I'll give it a shot. Coffee donation incoming!
-Mat
Here's a (Windows-only) build with the changes:
downloadIt adds:
-2 options to the nametable viewer to toggle the highlight of tile/attribute data changes
-Reset/Power Cycle shortcuts to the main debugger window (customizable - but you will have to customize these independently from the shortcuts in Options->Preferences)
-The ability to have multiple PPU viewer windows opened & set to update at different scanlines/cycles - it should run about as fast as before, or maybe a tiny little bit faster.
And thanks for the donation!
Hi!
I just got around to test the new feature. Its great! The one thing I would tweak is that I would highlight tiles/att changes regardless of whether the data has actually changed or not. When debugging scrolling (for example) you will often rewrite the same data (imagine a blue sky in mario), but you still want to know you did it correctly. The PPU is kind of a write-only thing for most developers.
-Mat
bleubleu wrote:
The one thing I would tweak is that I would highlight tiles/att changes regardless of whether the data has actually changed or not
Yea, I figured this was less than ideal. The current implementation is strictly a UI-side feature and it would actually require a lot more changes to be able to properly highlight all writes (as there is currently no tracking of PPU read/writes in the debugger). I'll add it to my list as a future improvement idea, but it might be a while before I can get to it.
gauauu wrote:
Is there a way to make it start in a random bank/banks? (which I realize is slightly complicated because it has to work for each banking scheme). It would be nice to be able to properly test to make sure my stubs to jump into the first bank are all working right.
I've added an option for this in the emulation options: "Randomize power-on state for mappers".
It only has an impact on some mappers - specifically, those you mentioned + most of the mappers covered by tepples' holy diver tests (since I figured those were also most likely good candidates for homebrew). It will randomize startup banks, and also other things like prg/chr banking modes or mirroring (when possible). It's far from perfect, but it should at least help just a little bit when trying to check for initialization bugs.
Hi.
I've been enjoying 0.9.6 so far. Such a good tool for development.
One tiny feature that I keep wanting to have would be to be able to jump to the memory viewer by right clicking on a Label in the debugger. I use debug info, so pretty much every symbol is there and often I am "what does this thing contain again?".
The ultimate would be to have 2 options (if applicable):
- Show in CPU memory
- Show in ROM/RAM memory (useful when a bank isn't currently mapped).
See attached image for a terrible ms-paint mockup.
-Mat
Do we want to count the ROM addresses relative to the start of PRG ROM (e.g. $000000-$01FFFF) or of the iNES image (e.g. $000010-$02000F)?
bleubleu wrote:
The ultimate would be to have 2 options (if applicable):
- Show in CPU memory
- Show in ROM/RAM memory (useful when a bank isn't currently mapped)
If I remember correctly, rainwarrior also requested something similar to this a while ago (although I think his case was to navigate from one memory type to the other within the hex editor, I'd have to find the post). These kinds of actions would probably be useful in a number of other places, too (e.g right-click in the code window, hex editor, etc.) It shouldn't be too hard to add these (not just in the label list, but in general), I'll try to get around to it soon.
tepples wrote:
Do we want to count the ROM addresses relative to the start of PRG ROM (e.g. $000000-$01FFFF) or of the iNES image (e.g. $000010-$02000F)?
Mesen currently has "PRG ROM" and "CHR ROM" addressing types for breakpoints/labels that count bytes based on the start of a particular memory type, rather than the offset in the .nes file.
Cool, thanks!
Let me know if you need testing.
-Mat
Hi.
Im getting a crash when setting a condition breakpoint. I simply set the expression to "a > 20" and i get this crash:
Code:
Unhandled Exception: System.AccessViolationException: Attempted to read or write protected memory. This is often an indication that other memory is corrupt.
at Mesen.GUI.InteropEmu.Run()
at Mesen.GUI.Forms.frmMain.<StartEmuThread>b__206_0()
at System.Threading.ExecutionContext.RunInternal(ExecutionContext executionContext, ContextCallback callback, Object state, Boolean preserveSyncCtx)
at System.Threading.ExecutionContext.Run(ExecutionContext executionContext, ContextCallback callback, Object state, Boolean preserveSyncCtx)
at System.Threading.ExecutionContext.Run(ExecutionContext executionContext, ContextCallback callback, Object state)
at System.Threading.ThreadHelper.ThreadStart()
[Finished in 44.3s]
Not sure if it will crash in any game or just mine.
-Mat
bleubleu wrote:
Not sure if it will crash in any game or just mine.
I can't seem to make it crash on my end, could you show me a screenshot of the breakpoint's edit window? Does it crash as soon as you enter the condition and click ok?
Could you try using a similar/identical breakpoint on another game to see if you get similar results?
bleubleu wrote:
The ultimate would be to have 2 options (if applicable):
- Show in CPU memory
- Show in ROM/RAM memory (useful when a bank isn't currently mapped).
I just added these to the label list's context menu (you can also assign shortcut keys for these).
Also, I've added "View in cpu memory", "View in [prg rom/work ram/save ram]", "View in disassembly" shortcuts in the hex editor (these can also be assigned shortcuts). "View in disassembly" is currently only available if the debugger window is already opened.
This should hopefully help navigation between windows a bit - let me know if you find any issues with it (or if you have other similar scenarios that would benefit from these kinds of shortcuts). The latest
AppVeyor build contain the changes.
If I open a ROM that crashes on startup, Mesen will kick me back out to the game select menu before I can open a debugger to try and see what happened. While in this menu I can't open a debugger either because it's greyed out in the menu. Maybe if the "developer mode" option is selected could this just open the debugger instead of exiting the game?
There's an option for this already (although it might not be as obvious as it should be) - if you turn on "Break on CPU crash" in the debugger (Options->Break options), it should open the debugger whenever a game is about to crash instead of unloading the game.
Sour wrote:
bleubleu wrote:
The ultimate would be to have 2 options (if applicable):
- Show in CPU memory
- Show in ROM/RAM memory (useful when a bank isn't currently mapped).
I just added these to the label list's context menu (you can also assign shortcut keys for these).
Also, I've added "View in cpu memory", "View in [prg rom/work ram/save ram]", "View in disassembly" shortcuts in the hex editor (these can also be assigned shortcuts). "View in disassembly" is currently only available if the debugger window is already opened.
This should hopefully help navigation between windows a bit - let me know if you find any issues with it (or if you have other similar scenarios that would benefit from these kinds of shortcuts). The latest
AppVeyor build contain the changes.
Thanks man! I will try that soon. As for the crash I am not getting it right now. Next time i have it ill save the ROM, line number and condition i used.
-Mat
rainwarrior wrote:
If I open a ROM that crashes on startup, Mesen will kick me back out to the game select menu before I can open a debugger to try and see what happened. While in this menu I can't open a debugger either because it's greyed out in the menu. Maybe if the "developer mode" option is selected could this just open the debugger instead of exiting the game?
Yeah, I'd like to request the same thing! I run in to this a lot when doing large scale refactors or setting up little test projects.
samophlange wrote:
Yeah, I'd like to request the same thing! I run in to this a lot when doing large scale refactors or setting up little test projects.
I think Sour answered this.
Quote:
There's an option for this already (although it might not be as obvious as it should be) - if you turn on "Break on CPU crash" in the debugger (Options->Break options), it should open the debugger whenever a game is about to crash instead of unloading the game.
-Mat
Another case where data before code garbles the opcodes in the debugger. In this instance, the code and data table are in RAM. Put an execute breakpoint on "reg_write" ($031B) to see the problem. (
source, this one's easier to build than that other thing I was working on)
Turning off the option to "disassemble unidentified code" sort of helps, but only if i've executed this function before (otherwise it will appear line by line as I execute it... though this is why I normally want this option on all the time, I am often looking around for new code, branches untaken, etc.)
Is there a CDL for RAM? The code seems to be highlighted and identified for disassembly, but right clicking the "mark selection as..." option is greyed out. (Also notice that the memory view seems to let you manually mark CDL this way too, but not in CPU view, only in PRG ROM view, which is maybe not easy to jump between, esp. since CPU view seems to be the one that "edit in memory view" takes you to from the disassembly view.)
Also, not related to this, but I believe the 5B frequencies are off by 1?
I changed a couple of things with the RAM's disassembly logic:
-The disassembly for RAM (all types) should properly realign itself whenever verified code is found
-The disassembler will keep disassembling instructions in RAM until an inconditional jump instruction is found (e.g rts, rti, jmp), like it already does for PRG ROM/Work RAM/Save RAM.
The first one should fix your issue, and the second makes the disassembly view a bit more useful when the "disassemble unknown code/data " option is not enabled.
There is no CDL for RAM - but the disassembler does keep a cache of known instructions that have been executed in RAM and uses that to disassemble (this can't be manipulated by the user, though). The cache is invalidated as the contents of memory changes. It's normal for the CPU memory view to not let you use the "mark selection as.." actions on RAM, it should only be enabled on PRG ROM.
rainwarrior wrote:
Also, not related to this, but I believe the 5B frequencies are off by 1?
Are you asking because you noticed the difference by listening to it, or because you checked the code?
There is in fact a very suspicious looking +1 here:
https://github.com/SourMesen/Mesen/blob ... udio.h#L58Not sure why it's there, but that would probably be the cause?
samophlange wrote:
Yeah, I'd like to request the same thing! I run in to this a lot when doing large scale refactors or setting up little test projects.
The "Break on CPU crash" option I mentioned should work - let me know if it doesn't though.
Sour wrote:
rainwarrior wrote:
Also, not related to this, but I believe the 5B frequencies are off by 1?
Are you asking because you noticed the difference by listening to it, or because you checked the code?
There is in fact a very suspicious looking +1 here:
https://github.com/SourMesen/Mesen/blob ... udio.h#L58Not sure why it's there, but that would probably be the cause?
I noticed the difference audibly while working on
a 5B audio test, but I also checked with a recorded output to make sure it wasn't just the dynamic pitch synchronization thing.
I didn't analyize your code, but that +1 in your code implementation is probably the cause. A weird thing with 5B is that the "0" value seems to give a division by zero in the frequency formula, so maybe that creates a temptation to "fix" this with +1. (I'm not sure whether the chip halts at pitch 0 or what, but pitch 1 is already above audible at 55kHz.)
Sour wrote:
samophlange wrote:
Yeah, I'd like to request the same thing! I run in to this a lot when doing large scale refactors or setting up little test projects.
The "Break on CPU crash" option I mentioned should work - let me know if it doesn't though.
It works but you have to set it up before you try to run the ROM, because the option you need to set is inside the debugger that you can't open without a running ROM.
I had a similar issue with one of my bug. My workaround was to start a different rom, pause it, start the one which fail and the new rom would start in paused mode (maybe by design, not sure). Then after that I would be able to set a breakpoint at the desired location.
It would be useful to have a mode in preference to not auto-start like nintendulor F2. It would be quite useful for those case.
I think the real problem is just that the halt instruction boots you from the game and unloads it. That's kind of weird in itself. The cartridge doesn't fly out of the NES when that instruction is hit.
Displaying a message that the game has crashed is cool, but I think it would make a lot more sense if the emulator just paused or halted but left you with the game, giving you the option to reset.
Just the image of the cartridge flying out of the nes: Attack of the killer nintendo
Now on a serious note, yes, to stop and show the debugger where the program halted could help but sometime it could be that it just went on a wrong address and ended up in data. I don't know if there is a stack of the last commands before it failed in that case. But still, that is better than just stopping the emulator from a developer point of view. A user would just need the emulator to stop like it is doing at the moment.
To be honest, the whole "close the game on crash" has been pretty annoying on my end too, given how often I end up testing/fixing games that crash due to bugs in obscure mappers, etc. It was originally meant to be a user-friendly way to handle CPU crashes for end users, but for people trying to debug ROMs, it has the opposite effect.
I changed it so that it no longer does this when Developer Mode is enabled, which makes a lot of sense, imo. In Dev Mode, it will still display the "cpu crashed" error (once per reset/power cycle), but the cpu will keep running as per usual afterwards.
The 5B audio should be fixed now, too.
I am not sure if it was discussed before or not. But when I use ca65, I use anonymous labels for local loops, which are not exported as symbols. Can the debugger auto assign labels to those jumps if they are within the same procedure?
So instead of
Code:
8054 LDA Pallete,X
8055 STA PpuData_2007
8056 INX
8057 CPX #$20
8058 BNE $8054
Display something like
Code:
@label213:
8054 LDA Sprites,X
8055 STA OamData,X
8056 INX
8057 CPX #$10
8058 BNE @label213
I know I can double click on the address, but it would be nice to visually find where it loops to without scrolling jumps or looking trough addresses.
The debug information from ca65 unfortunately doesn't have any output for anonymous labels.
However, it might be nice to have any branch within view (or maybe within 128 bytes of in view) to a location without a label automatically generate a label there? That'd be useful even when not using ca65.
da65 has a convention for automatically naming labels by their address, i.e. "LFF35:" would go to $FF35. The specific name is probably less important than just the visual break you get for a label.
Dynamically generating labels around the current view would be sort of hard - the disassembly is generated when the debugger updates (e.g when stepping through the code), but not when scrolling (everything is already disassembled ahead of time at that point). It would also be a bit tricky to handle scrolling properly if labels appear/disappear as the user scrolls.
I've been thinking about it for a little bit and there's a couple of options I could probably do:
A) Make the disassembler keep track of all jump destinations it finds while disassembling and add fake temporary "labels" for them, which might look something like this:
Code:
$8054:
8054 LDA Sprites,X
8055 STA OamData,X
8056 INX
8057 CPX #$10
8058 BNE $8054
These wouldn't show up in the label list, though (as they wouldn't be real labels). This would technically work for any type of memory (RAM, ROM), but when disassembling unverified bytes you could end up with random labels all over (so it would probably require ignoring jump from inside unverified code to verified code, etc.)
B) Create proper labels for all of PRG ROM as the code runs, e.g automatically create a real label whenever a label-less jump target is found (if the target is in PRG ROM). This would be a lot less of a hack, code-wise, and has the benefit that the labels would be permanent, but maybe it would result in too many labels? This would also be limited to PRG ROM code that already been executed by the CPU. In this case you might end up with this:
Code:
L38054:
8054 LDA Sprites,X
8055 STA OamData,X
8056 INX
8057 CPX #$10
8058 BNE L38054
(assuming that $8054 in CPU memory maps to $38054 in the PRG ROM, for example)
Personally I'm more inclined to go with B) - it would be a lot more straightforward to implement, and would probably be the best when trying to reverse-engineer/annotate a ROM's code. The main downsides would be that it wouldn't work for FDS games, or when games execute code from RAM.
If B) doesn't feel like it would be useful, though, I can try to figure out something else/better.
Both versions look great. Even just having this visual clue, will help a lot. Usually you have 2-3 branches around and even if they overlay, you can just remember the numbers.
Just a random thought after poking IDA today. Can we convert these pseudo/auto labels into the real labels and give them names? It is not necessary that I would use it, but it may help people who study old games.
A quick test gives something like this:
Attachment:
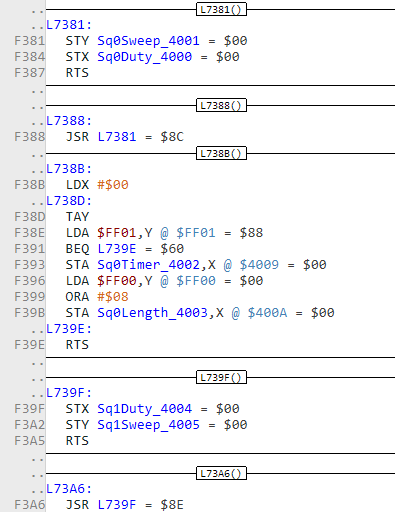 autolabels.png [ 26.83 KiB | Viewed 11063 times ]
These are regular labels that get auto-generated by the debugger as it runs, so yes, they can be renamed, etc.
As I have it now, they can't really be erased while the option to create them is enabled, though. (they will get recreated after being deleted).
The labels are only created once the CPU reaches the branch instruction (otherwise there is no guarantee that the target will be the same once the instruction is reached, because of bank switching, etc.). In terms of integration with CA65, that means they would get deleted every time you power cycle or reload the ROM, but get recreated each time as you run the code again.
I'm thinking of adding 2 separate options to control this:
-1 option to control if labels should be auto-generated for PRG ROM jumps (behavior would be identical to 0.9.6 when disabled)
-1 option on the label list to "Show generated labels", which would show/hide those labels in the label list (but they would still be used in the disassembly, whether or not they are shown in the list). This would help keep the list shorter and easier to work with (and the list would get populated as you rename the labels manually)
Sour wrote:
that means they would get deleted every time you power cycle or reload the ROM, but get recreated each time as you run the code again.
Is it possible to keep the generated/renamed labels in the "Workspace.xml" file along with hash of the rom, and leave them in place if hash is not changed?
If user study the existing game rom, it may take more than one reload to study code, label procedures (to remember what they do later).
I am no NES developer (or yet at least), but I'm looking from the point of my current development job. If I understand correctly, unless jump address is within ram range ($000-$7FF) and rom has not changed, there is no reason to forget labels on reset/power cycle. I may be wrong here though.
yaros wrote:
Is it possible to keep the generated/renamed labels in the "Workspace.xml" file along with hash of the rom, and leave them in place if hash is not changed?
This is already the case, assuming you're not loading a .dbg file. Every time a .dbg file is loaded, it resets all existing labels, which would include these auto-generated labels (which is what I was referring to in my previous post)
Saving the PRG ROM's CRC in the workspace.xml file and auto-resetting the generated labels when that changes shouldn't be all that hard, though (I've also been meaning to add a similar option with regards to the CDL files for a while now, but never got around to it).
I'll try to finish this feature up at some point this week if I can.
Sour wrote:
Every time a .dbg file is loaded, it resets all existing labels, which would include these auto-generated labels (which is what I was referring to in my previous post)
Oh, I see what happens.
I want to explain though. I am not trying to push this idea as it is must be/must have, you are the author and maintainer in the end of the day. I haven't touched assembler in ages and frankly didn't even finish my "pong". Those are the things I just noticed poking the Mesen debugger (which is honestly already amazing) and after seeing this thread I though to chime in.
Some minor bug reports (mainly cosmetical):
Debug -> Memory Tools -> Memory Viewer tab. The "View" pulldown (for "CPU Memory", "PPU Memory", etc.) is not wide enough to display the full name of some entries, particularly "Sprite (OAM) RAM" (shown as Sprite (OAM) RA) and "Secondary OAM RAM" (shown as Secondary OAM). I know this varies per OS/theme/DPI/etc. a bit, but it looks like there's a lot of space available to the right of that pulldown..... ;-)
Debug -> Memory Tools -> Memory Viewer tab. The latter two "View" pulldowns should be syntactically similar; "Sprite (OAM) RAM" and "Secondary OAM RAM" seem weird (particularly the inconsistent use of parenthesis). I know the secondary OAM table is unique/sort of an oddity, but still. Might I suggest alternatives:
- "Sprite/OAM RAM" + "Secondary OAM RAM"
- "Primary OAM RAM" + "Secondary OAM RAM"
- "Primary (OAM) RAM" + "Secondary (OAM) RAM"
- "Primary Sprite RAM" + "Secondary Sprite RAM"
If this conflicts with existing naming schemes you have throughout the program and would have to do a global replace + ensure all the fields are wide enough for changes, don't bother.
Debug -> Memory Tools -> Memory Viewer tab. Why is the "View" pulldown in a completely different theme/thing than the Access Counters "View" pulldown and several others under Memory Tools? Maybe it's because it has horizontal section dividers?
Debug -> APU Viewer -> there are inconsistencies in the spacing/alignment of some of these fields:
- Square 1 and Square 2: Sweep Unit "Period" and "Shift" texts are slightly indented compared to the checkboxes/states above
- Triangle: "Period", "Timer", "Frequency", and "Output Volume" are slightly indented. This may be because
- Triangle: Change "Sequence Position" to "Sequence Pos" or "Sequence Pos." so that the text fits within the space available and doesn't look "too close" to the actual field data
- Square 1, Square 2, and Noise: Envelope checkboxes/states ("Start Flag", etc.) need to be shifted to the right a little bit to be consistent with the rest of the other sections/UI
- Square 1, Square 2, and Noise: "Counter", "Divider", and "Volume" need to be aligned properly with above checkboxes/states once fixed
- DMC: "Bytes remaining" should have a capital "R"
- DMC: "Sample Rate" "Hz" suffix should be moved over to the left a little bit (3-4 pixels? See Square 1 & 2, or Triangle for examples)
- Frame Counter: "Current Step" need to be aligned properly with above checkboxes/states (moved to left a couple pixels)
- Frame Counter: "5-step Mode" should have a capital "M"
- Channel Control: horizontal spacing between "columns" of checkboxes should be more consistent/evenly distributed
- Channel Control: "Namco" should be "N163", "Sunsoft" should be "5B" (rest of UI uses chip names, not company names, ex. MMC5, VRC6)
For the APU Viewer, I've attached a screenshot with some vertical alignment lines to give you an idea of what I'm talking about.
Some of my above items might seem inconsistent in their recommendations, but the overall goal is: make all the stuff consistent. Haha :D
Not bragging, but yeah, I have an incredible eye for this sort of thing. I can often tell if something is 1 pixel off on a 24" @ 1920x1200 display; I've been called nuts (and OCD) more than once. ;-) The amusing part: I have *horrible* vision -- I got checked last week: nearsighted, 20/200 (not a typo).
P.S. -- Event Viewer is absolutely mind-blowing. When I discovered this (it's been a while since I've used Mesen), I sat here with my mouth agape.
P.P.S. -- If you would prefer this be filed in GitHub Issues, happy to do so (I just now noticed the "Report a bug" pulldown).
Thanks! Most of these should be fixed now.
koitsu wrote:
Debug -> Memory Tools -> Memory Viewer tab. Why is the "View" pulldown in a completely different theme/thing than the Access Counters "View" pulldown and several others under Memory Tools? Maybe it's because it has horizontal section dividers?
Yes, I can't really do much about it. I turned on "owner draw" for the dropdown list items to display proper separators (as opposed to just an empty option filled with dashes), but the dropdown's styling, for some reason (on Win 10 this is limited to the background color being different, but I think Win 7 makes it more obvious?). IIRC, I tried fixing this when I first implemented the dropdown, but could not find a way to manually draw the contents of the dropdown without altering the dropdown's style.
koitsu wrote:
P.S. -- Event Viewer is absolutely mind-blowing. When I discovered this (it's been a while since I've used Mesen), I sat here with my mouth agape.
Most of the credit for the event viewer goes to Bananmos for making the request in the first place :p
yaros wrote:
Can the debugger auto assign labels to those jumps if they are within the same procedure?
FYI, 0.9.7 adds a "Auto-create jump labels" feature to the debugger, which will create labels for all jump locations that the debugger finds while the code is executing (this feature is available whether or not you're using .dbg files)
I didn't have the time to make them persist after a .dbg file is loaded yet, though. You can technically work around this by either disabling the option to automatically load .DBG files or by disabling the "Reset workspace labels [...] before importing DBG/MLB files" option found in File->Workspace->Import Settings, though. Keep in mind that disabling this option may cause labels that no longer exist (e.g because you changed the code and rebuilt the ROM) to remain in the label list, so it's not a perfect solution.
Thank you Sour. It looks great.
So I finally took the time to download Mesen after fceux crashed because I tried a mmc3/chr-rom/chr-ram/wram combo.
I've only briefly tried out the debugging features, but I was immediately impressed. The event viewer is really helpful and showed me that my irq fires 1 scanline early for a few frames after reset. Something I hadn't noticed, even on hardware. Asm6 integration is a plus.
At this point, I don't see a reason to switch back. I'm going to dig deeper into the rest of its features and post any feedback if I have any. Thanks for all the work put into this.
Sour wrote:
bleubleu wrote:
The one thing I would tweak is that I would highlight tiles/att changes regardless of whether the data has actually changed or not
Yea, I figured this was less than ideal. The current implementation is strictly a UI-side feature and it would actually require a lot more changes to be able to properly highlight all writes (as there is currently no tracking of PPU read/writes in the debugger). I'll add it to my list as a future improvement idea, but it might be a while before I can get to it.
And so here we are, 9 months later and it's done! I added a "Ignore write that do not alter data" option to keep the old behavior, too, in case they are scenarios where the older behavior is useful. By default all tile/attribute updates (writes) done during the last frame are now highlighted, even if the value hasn't changed.
These changes required a number of changes to the core (because nametable ram did not work the same way as CHR RAM/ROM did for historical reasons) and I was more or less forced to break save state compatibility in the process. I've also added access counters for CHR ROM/RAM and nametable RAM, and the memory viewer now properly highlights reads and writes in chr rom/ram, palette and nametable ram, too. (Reads to palette ram aren't tracked for the sake of performance). This also fixes the display of the nametable mappings at the bottom of the nametable window (it should now always accurately represent the real state of the NES, including when CHR ROM/RAM is mapped between $2000-2FFF)
bleubleu wrote:
If I write "ptr,10" it will show me the 10 first element of the array starting at ptr.
I'm not sure if I ever mentioned this, but it's been possible to display arrays in the watch for a now, syntax is "[address, byte count]". e.g: [mylabel, 16] or [$A0, 16]
Dude, thank you so much.
Just this weekend I was debugging a function to clear text, and I wasnt sure if I was writing at the right location and I was like "man, it would be so nice to be able to see the tile updates even if the value didnt change".
I didn't realize the array feature was already working. I will definitely use that all the time.
Coffee money incoming!
-Mat
I just tried it.
Is there any way to force Mesen to update the PPU viewer every frame (even if it is slow) ?
Seems like its updating every few frames, so I miss updates from time to time.
Alternatively, another workaround would be to leave the updated tiles on screen for a few milliseconds.
Both works for me.
-Mat
bleubleu wrote:
Is there any way to force Mesen to update the PPU viewer every frame (even if it is slow) ?
Seems like its updating every few frames, so I miss updates from time to time.
Yea, this is an issue I noticed yesterday myself. The PPU viewer only updates at 15fps at most - if you slow down the emulation to 25%, you should see every frame (although that's probably not ideal). I'll look into adding a "refresh speed" option like in the memory tools (60fps should be possible, I think)
Oh that's a decent workaround. Ill give it a go.
-Mat
I added a "Refresh speed" option in the PPU viewer (defaults to ~30fps but can be set to 60fps). Seems to be working pretty nicely on my end, let me know if you have any issues with it.
And, forgot to say this this morning when I replied, but thank you for the donation!
Fantastic. I will give it a try.
I running a build for a couple nights ago. Did you change something in the debugger? Im having a hard time adding a watch to view variables as WORDs ({xxxx} notation). Seems like it doesnt work anymore.
The debugger clearly knows the right address as they are present in the "labels" list, but somehow it doesnt work. I can send a ROM if you need.
Also, hovering my mouse on the variable in the disassembly shows the correct BYTE/WORD value. Im puzzled.
-Mat
I fixed a number of issues in the expression evaluator a couple of weeks ago, might have broken this in the process. I'll take a look.
This was actually a bug caused by the multi-byte labels. Since labels imported from CA65 are automatically converted to multi-byte labels when appropriate now, I imagine that's how you ended up finding this.
Should be fixed in the latest appveyor build.
Beautiful! It works! Thanks!
-Mat
Hi.
I got this today while debugging. First time ever. I think it happened when I was supposed to hit a breakpoint (?) Not sure.
Not sure the callstack is good enough to pinpoint the problem. Good luck
-Mat
Uhm... haven't done any testing yet, but my best guess would be that there is a specific label that's causing the code to crash while trying to display a row in the disassembly. I think a label that ends in "+" might cause it, but manually creating that kind of label should no longer be possible as of a few weeks ago.
I'll do some testing on my end and see what I can find when I have a chance.
I might be running a build from 1+ month ago (whenever the last time you added me a feature!).
I will take a new nightly and give it a try.
-Mat
Hi!
I want to create myself some simple debugging Lua scripts to display the state of my hero, NPCs, etc. Is it possible to access debug info from Lua? This would avoid me having to hard-code addresses of stuff (which changes all the time during development).
Thanks!
-Mat
In the latest dev builds, there's a "emu.getLabelAddress" function that returns an address that can be used with emu.read/write. See:
https://github.com/SourMesen/Mesen/blob/master/Docs/content/apireference/MemoryAccess.md#getlabeladdressAnd that's another reason why I really need to get around to releasing a new release and updating the documentation website. Not enough hours in a day, and not enough days in a weekend :p
Haha. Thanks is brilliant! Thanks!
I'll give it a try soon. I think I can make myself a really kickass visual debugger for gameplay with that.
-Mat
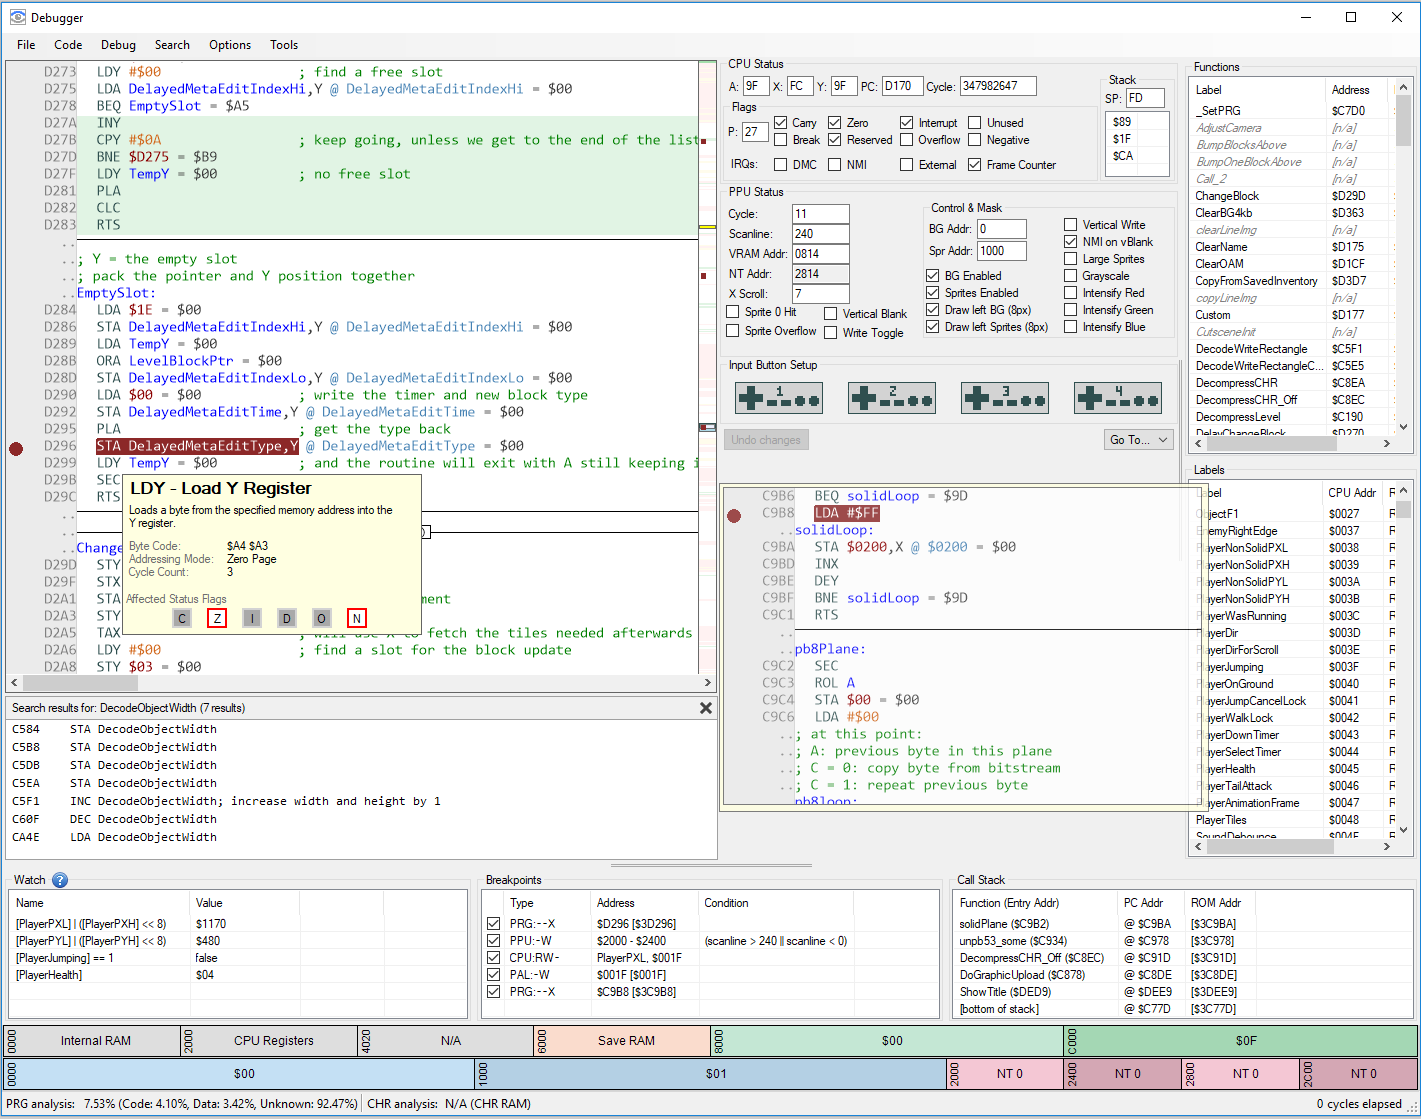
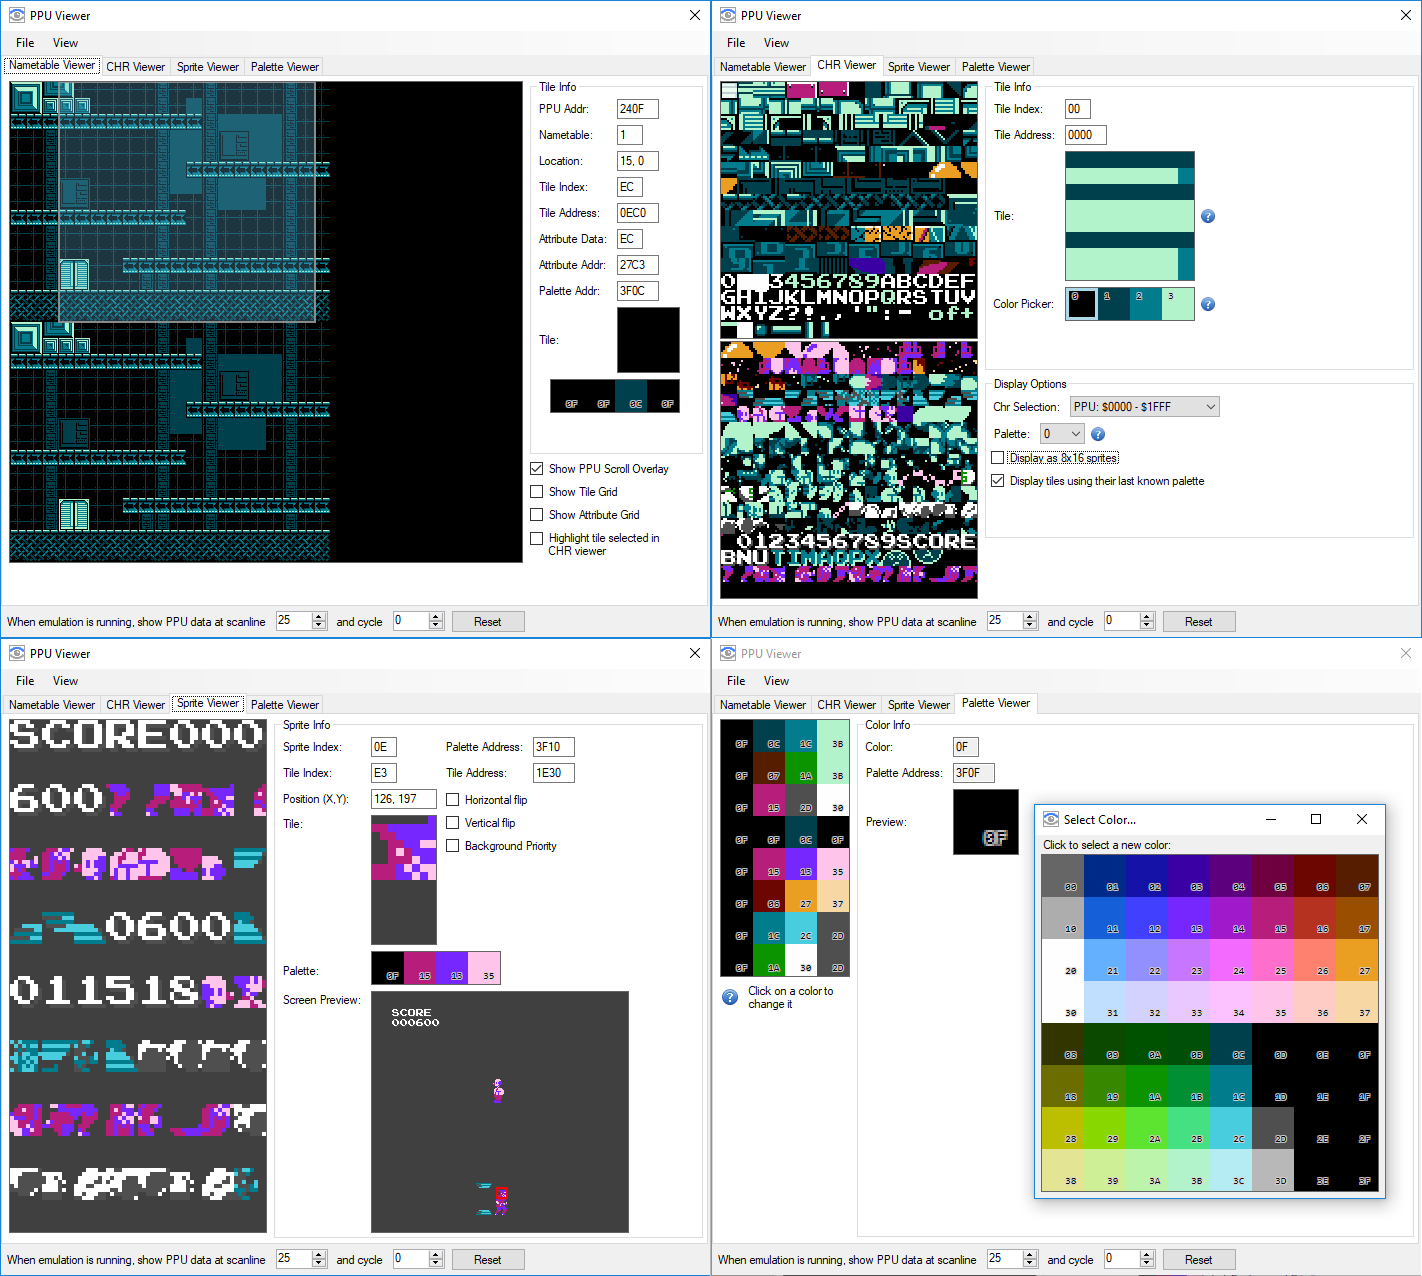
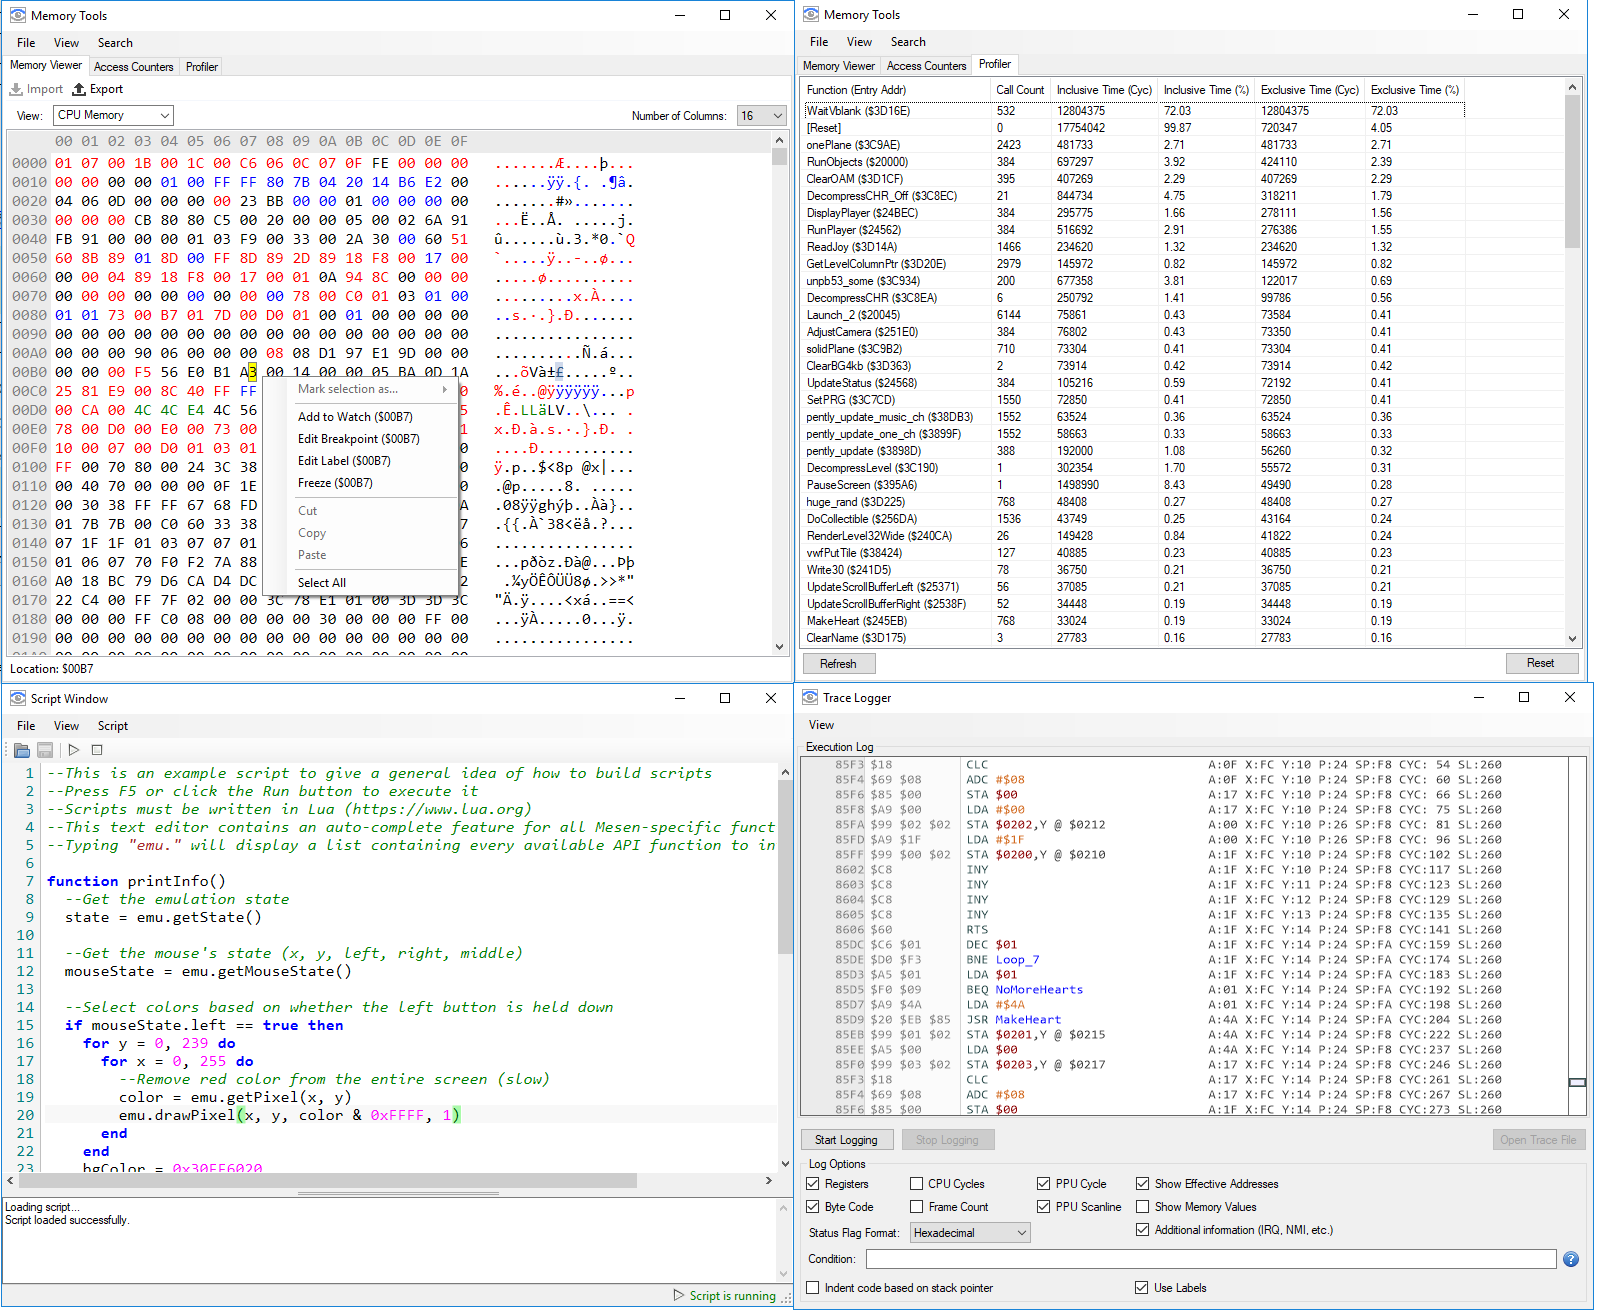
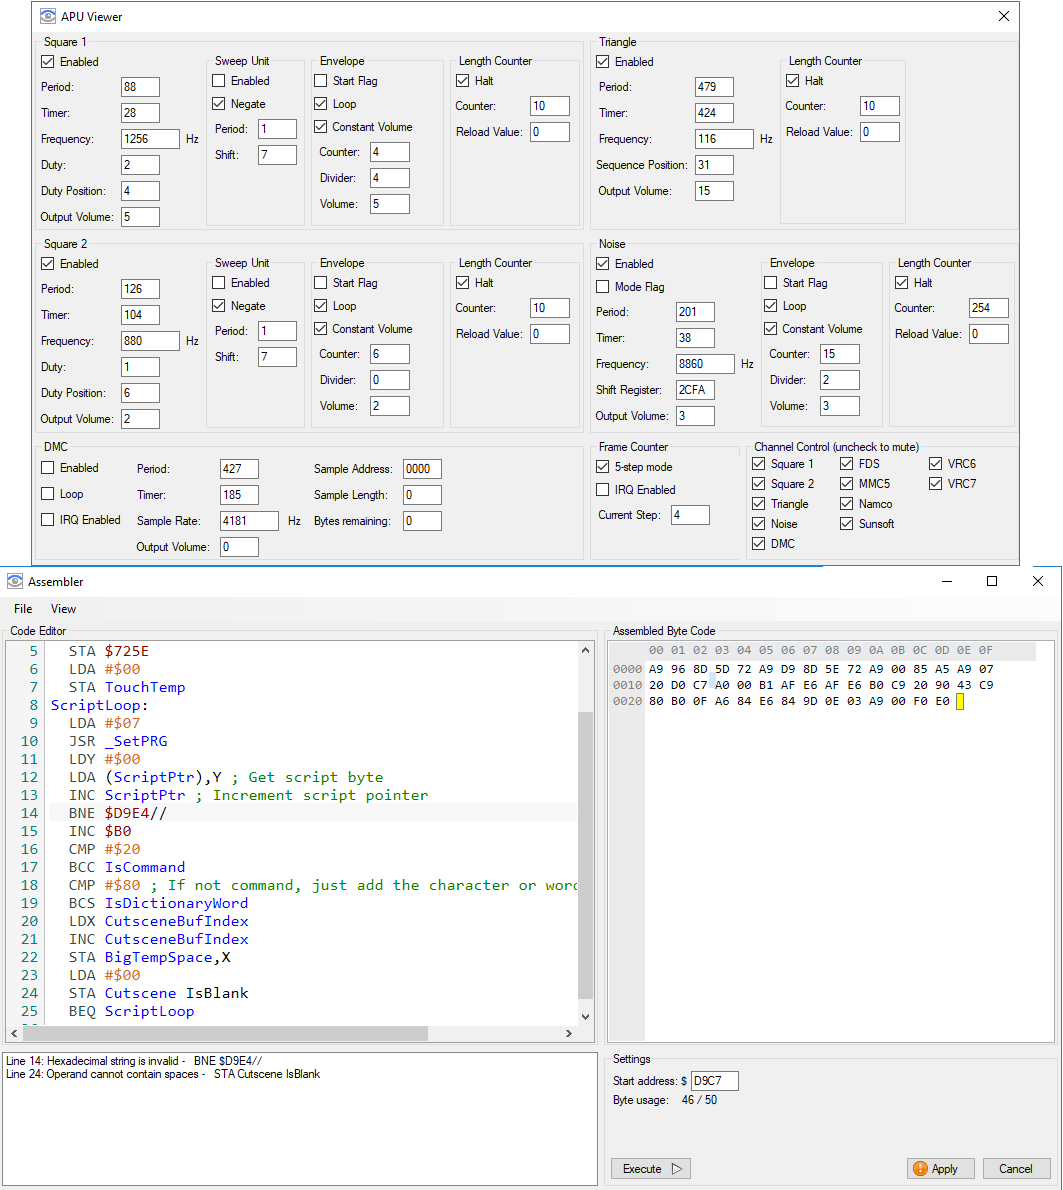